
Fig. S5
- ID
- ZDB-FIG-180627-33
- Publication
- Flanagan-Steet et al., 2018 - TGF-ß Regulates Cathepsin Activation during Normal and Pathogenic Development
- Other Figures
- All Figure Page
- Back to All Figure Page
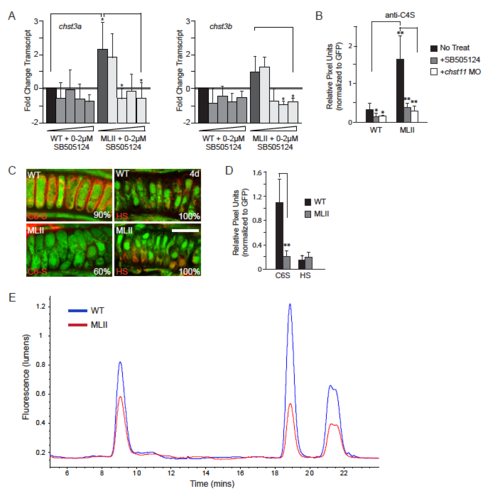
Increased C4-S stimulates Ctsk in MLII. A) qPCR anlyses of the C6-S sulfotrasferases (chst3a and chst3b) in WT and MLII embryos treated with increasing concentrations of SB505124. Data represent average difference between drug treated and untreated samples. n=3 independent experiments. Error = S.D. * = p < 0.05 B) Graph represents pixel intensity of C4S stain (normalized to GFP fluoresence) in sections of WT and MLII embryos under various conditions. Error = S.D. * = p < 0.05, ** = p<0.01 C) Confocal images of WT and MLII fli1a:EGFP sections stained immunohistochemically for either C6-S (6-O sulfated chondroitin sulfate) or HS (heparan sulfate proteoglycans)indicate that the abundance of C6-S GAGs is reduced in MLII chondrocytes, but HS abundance is unaffected. D) Graph of quantitation of pixel intensity of C6S and HS stains (normalized to GFP fluoresence) in sections of WT and MLII embryos under various conditions.Scale bar = 10μm. Error = S.D. ** = p < 0.01 C) Graph representing overlay of the WT and MLII SAX HPLC data described in Figure 6. |