
Fig. 6
- ID
- ZDB-FIG-180627-30
- Publication
- Flanagan-Steet et al., 2018 - TGF-ß Regulates Cathepsin Activation during Normal and Pathogenic Development
- Other Figures
- All Figure Page
- Back to All Figure Page
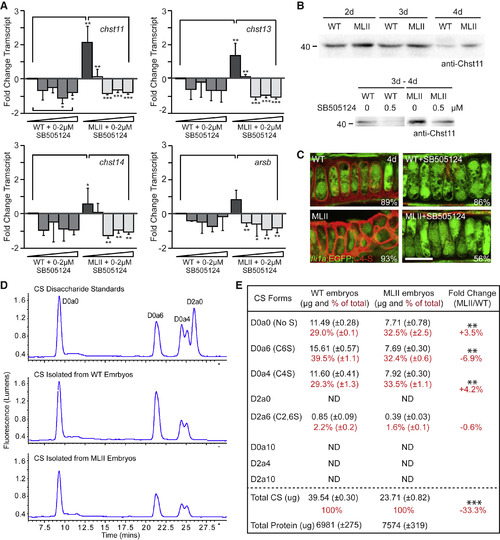
TGF-ß-Mediated Regulation of C4-S Controls Ctsk Activity (A) qRT-PCR of chondroitin-4-sulfate biosynthetic enzymes (chst11, 13, and 14) in TGF-ß-inhibited WT and MLII embryos 4 dpf. n = 4 experiments. Error bars, SD; ∗p < 0.05, ∗∗p < 0.01, ∗∗∗p < 0.001. (B) Western blots of Chst11 in WT and MLII embryos 2–4 dpf and in TGF-ß-inhibited embryos. n = 3 experiments. d, dpf. (C) Immunohistochemistry of C4-S (red) in fli1a:EGFP WT and MLII cartilage sections. n = 15–20 embryos per condition from 3 experiments. Percent values are the number of embryos that resemble the picture. Scale bar, 10 μm. (D and E) Traces of SAX HPLC for chondroitin sulfate forms in WT and MLII embryos (D). Table of SAX HPLC data (E). n = 3 technical replicates of 1 biological set with 1,200 embryos per sample. A second biological sample is presented in Figure S6. Error bars, SD; ∗∗p < 0.01, ∗∗∗p < 0.001. Standards for additional sulfo-forms, including C2,6S (D2a6), were also used. Because of their late elution time and low detection levels, these data were not included in the raw traces. See also Figure S5. |
| Genes: | |
|---|---|
| Antibody: | |
| Fish: | |
| Condition: | |
| Knockdown Reagent: | |
| Anatomical Terms: | |
| Stage Range: | Long-pec to Day 4 |
| Fish: | |
|---|---|
| Condition: | |
| Knockdown Reagent: | |
| Observed In: | |
| Stage Range: | Long-pec to Day 4 |