
Fig. 3
- ID
- ZDB-FIG-180627-28
- Publication
- Flanagan-Steet et al., 2018 - TGF-ß Regulates Cathepsin Activation during Normal and Pathogenic Development
- Other Figures
- All Figure Page
- Back to All Figure Page
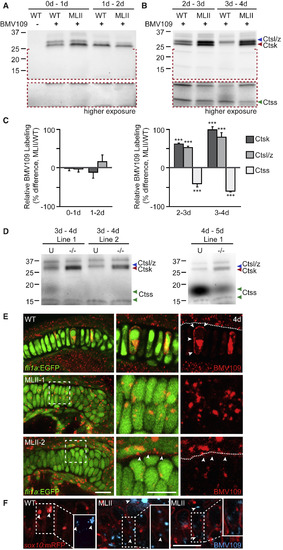
Cathepsin Activities Are Altered in MLII (A) In-gel analyses show Cts activities in WT and MLII embryos 0–1 and 1–2 dpf. n = 4 experiments. (B) Analyses of BMV109-labeled embryos 2–3 and 3–4 dpf. n = 4 experiments. (C) Quantitation of the Ctsk, Ctsl/z, and Ctss bands from 4 experiments. Error bars, SD; ∗∗∗p < 0.001. For all gels, the equivalence of total protein loaded per lane was evaluated using the stain-free method described in the Experimental Procedures. (D) BMV109 labeling of gnptab TALEN-mediated stable knockout embryos 3–4 dpf. U, unaffected (gnptab+/+ and gnptab+/− embryos); (−/−), gnptab−/− from two null zebrafish lines. n = 3 experiments. (E) Live confocal analyses of BMV109-labeled (red) fli1a:EGFP (green) WT and MLII embryos. White boxes indicate magnified views shown in the center (green and red) and at the right (red, BMV109). White arrows highlight pericellular puncta in WT and extracellular activity in MLII. Dotted lines demarcate cell boundaries. n = 15 embryos from 3 experiments. (F) Live confocal analyses of BMV109-labeled activity (blue) in sox10:mRFP (red, membrane-bound) transgenic embryos. In the WT, BMV109 reactivity (blue) co-localizes with RFP-positive cellular regions (see RFP-negative inset, white arrows) but can be found extracellularly (white arrows) in MLII embryos. The insets represent magnified views of the boxed areas. Scale bars, 10 μm. See also Figure S1. |