
Fig. 1
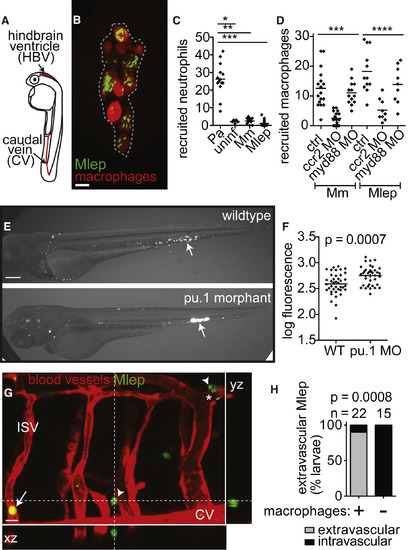
Early M. leprae-Macrophage Interactions Are Typical of Other Mycobacterial Infections (A) Diagram of larva 2 days post-fertilization (dpf) with injection sites indicated. (B) Representative confocal image of an early aggregate of fluorescent macrophages (dashed line) adjacent to the yolk sac in a 6 dpf mpeg1:Brainbow larva at 4 days post-infection (dpi) with ∼104 fluorescent M. leprae. Scale bar, 10 μm. (C) Mean number of neutrophils recruited to the hindbrain ventricle after injection of ∼100 colony-forming units (CFUs) of P. aeruginosa (Pa), M. marinum, or M. leprae in a 2 dpf larva at 4 hr post-infection; ∗p < 0.05; ∗∗p < 0.01; ∗∗∗p < 0.001 (one-way ANOVA with Bonferroni’s post-test). (D) Mean number of macrophages recruited to M. marinum (Mm) or M. leprae (Mlep) injection, like in (C), in wild-type (ctrl) animals or those made deficient in CCR2 or MyD88 by morpholino (MO) injection; ∗∗∗p < 0.001, ∗∗∗∗p ≤ 0.0001 (one-way ANOVA with Bonferroni’s post-test). (E) Representative fluorescent images of 2 dpi (4 dpf) WT or macrophage-deficient pu.1 morphant larvae, infected with fluorescent M. leprae like in (B); the arrow indicates the injection site. Scale bar, 100 μm. (F) Mean bacterial burden of larvae in (E); unpaired Student’s t test. (G) Representative confocal image of the fluorescent vasculature of a 2 dpi (4 dpf) kdrl:dsRed larva infected with fluorescent M. leprae; bacteria reside within macrophages, apparent by Nomarski microscopy (Figure S1). The arrow indicates M. leprae retained within vessels; arrowheads indicate M. leprae outside of vessels; ISV, intersegmental vessel; asterisk, M. leprae-infected macrophage surrounding the abluminal surface of the vessel. (H) Proportion of larvae in (G) with M. leprae disseminated outside or contained within the vasculature, 4 days after caudal vein infection, in larvae depleted of macrophages, or not, by clondronate injection (Fisher’s exact test). n = number of larvae per group; all data representative of at least three separate experiments. See also Figure S1. |
| Fish: | |
|---|---|
| Conditions: | |
| Knockdown Reagents: | |
| Observed In: | |
| Stage: | Day 4 |
Reprinted from Cell, 170, Madigan, C.A., Cambier, C.J., Kelly-Scumpia, K.M., Scumpia, P.O., Cheng, T.Y., Zailaa, J., Bloom, B.R., Moody, D.B., Smale, S.T., Sagasti, A., Modlin, R.L., Ramakrishnan, L., A Macrophage Response to Mycobacterium leprae Phenolic Glycolipid Initiates Nerve Damage in Leprosy, 973-985.e10, Copyright (2017) with permission from Elsevier. Full text @ Cell