
Fig. 3
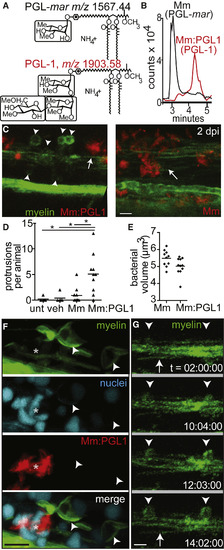
Phenolic Glycolipid 1 Triggers Myelin Dissociation (A) Normal phase high-performance liquid chromatography mass spectrometry measured at the known mass-to-charge ratios (m/z) for triglycosylated and monoglycosylated forms of PGL, leading to the separate detection of PGL-mar (m/z 1,567.44, upper structure) and PGL-1 (m/z 1,903.58, lower structure) in total lipid extracts of the indicated strains (B). (B) Chromatograms of the ions depicted in (A), showing the increased retention time of PGL-1 from M. marinum:PGL-1 (Mm:PGL1) compared to that of PGL-mar from WT M. marinum. (C) Representative confocal images, like in Figure 2C, of 2 dpi (4 dpf) larvae infected with ∼200 CFU M. marinum or M. marinum:PGL-1; myelin protrusions are quantified in (D). Scale bar, 10 μm. (D) Mean number of myelin protrusions per animal in uninjected larvae (unt) or after injection with PBS vehicle (veh), M. marinum, or M. marinum:PGL-1 (∼200 CFU each; ∗p < 0.05, one-way ANOVA with Bonferroni’s post-test). (E) Mean bacterial burden at the injection site of larvae from (D). (F) Representative confocal image of a 6 dpf larva with fluorescently labeled nuclei, 4 dpi with M. marinum:PGL-1 (∼100 CFU). Asterisk indicates an aggregate of infected cells. Scale bar, 10 μm. (G) Stills from time-lapse imaging of an mbp larva injected with M. marinum:PGL-1, showing myelin protrusions forming from apparently intact myelin. Arrow, intact myelin sheath; arrowheads, myelin protrusions. Relative time code. Scale bar, 10 μm. See also Figures S2 and S3 and Movie S2. |
| Gene: | |
|---|---|
| Fish: | |
| Condition: | |
| Anatomical Term: | |
| Stage: | Day 4 |
Reprinted from Cell, 170, Madigan, C.A., Cambier, C.J., Kelly-Scumpia, K.M., Scumpia, P.O., Cheng, T.Y., Zailaa, J., Bloom, B.R., Moody, D.B., Smale, S.T., Sagasti, A., Modlin, R.L., Ramakrishnan, L., A Macrophage Response to Mycobacterium leprae Phenolic Glycolipid Initiates Nerve Damage in Leprosy, 973-985.e10, Copyright (2017) with permission from Elsevier. Full text @ Cell