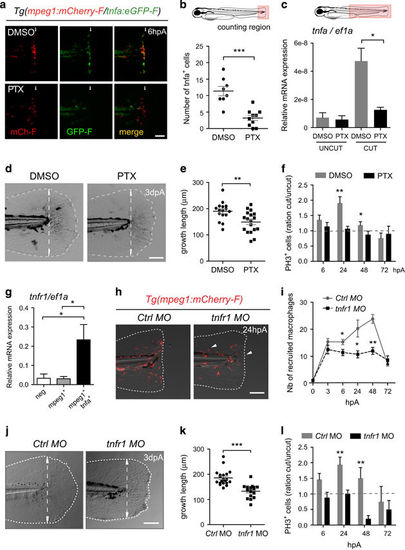
TNF signaling is required for caudal fin regeneration. (a) Tg(mpeg1:mCherry-F/tnfa:eGFP-F) larvae were amputated and treated with either DMSO or pentoxifylline (PTX). Representative fin images show single fluorescence channels and overlay of fluorescence (Merge) at 6 hpA. White arrows indicate the wound. (b) Number of GFP-F+ cells in the wound region in indicated conditions (Nlarvae=8–10, mean±S.E.M., two independent experiments, ***P<0.001). (c) qRT-PCR of tnfa mRNA relative to ef1a in DMSO or PTX treated larvae. Caudal fins were uncut or cut at 3 dpf and larvae were immediately treated with DMSO or PTX. RNA was extracted from tails (18 larvae per sample, mean±S.E.M. of three experiments, *P<0.05). (d) Representative transmitted light images of fins at 3 dpA after DMSO and PTX treatments. (e) Regenerated fin length at 3 dpA in indicated conditions (mean±S.E.M., three independent experiments, **P<0.005). (f) Blastema cell proliferation at 6, 24, 48 and 72 hpA in indicated conditions. Mitotic cells were detected in the fin region using an anti-PH3 antibody (Nlarvae=13–23, average of cut/uncut ratio±S.E.M., two independent experiments, *P<0.05, **P<0.005). (g) Steady state levels of tnfr1 mRNA in sorted macrophages. Tg(mpeg1:mCherry-F /tnfa:eGFP-F) were amputated at 3 dpf and cells were collected at 6 hpA using fluorescence-activated flow cytometry and qRT-PCR used to quantify tnfr1 mRNA steady state levels relative to ef1a in the following cell populations: mpeg1−tnfa− (neg), mpeg1+tnfa− (mpeg1+) and mpeg1+tnfa+ (mean values of four independent experiments±S.E.M. *P<0.05). (h) Fin images are representative overlays of mCherry fluorescence with transmitted light of Tg(mpeg1:mCherry-F) control morphants (Ctrl MO) or tnfr1 morphants (tnfr1 MO) at 24 hpA. (i) Macrophages (mCherry-F+) recruitment in the wound region at indicated time points in Ctrl and tnfr1 morphants (Nlarvae=5–18 per group, mean±S.E.M., two independent experiments, *P<0.05, **P<0.005 respect to Ctrl MO condition). (j) Fin images are representative transmitted light images of Ctrl morphants and tnfr1 morphants at 3 dpA. (k) Corresponding regenerated fin length (mean±S.E.M. from three independent experiments, ***P<0.001). (l) Blastema cell proliferation at 6, 24, 48 and 72 hpA in indicated conditions was detected using an anti-PH3 antibody (Nlarvae=5–17, cut/uncut ratio±S.E.M., two independent experiments, **P<0.01). (a, d, h and j) Dotted lines outline the fin, dashed arrows indicate the position of the initial amputation; scale bar=100μm
|
