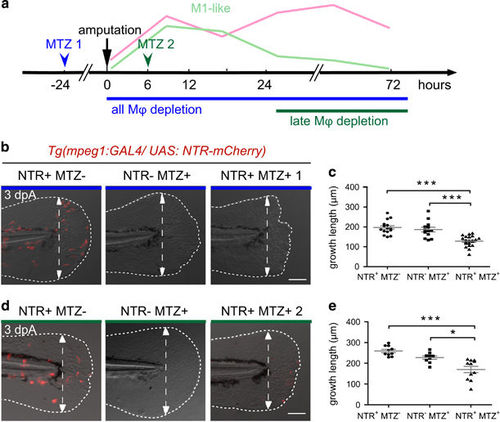
Genetic depletion of macrophages at different stages confirms the requirement of macrophages during fin regeneration. (a) Schedule of macrophage (Mφ) depletion using Tg(mpeg1:GAL4/UAS:NTR-mCherry) larvae and Metronidazol (MTZ) treatment. (b–e) Tg(mpeg1:GAL4/UAS:NTR-mCherry) larvae were treated with MTZ (NTR+ MTZ+) to deplete macrophages. DMSO treatments on the same line (NTR+ MTZ−) or MTZ treatments on WT siblings (NTR− MTZ+) were used as controls. (b) Treatments were performed from 48 hpf and fins were amputated at 3 dpf to deplete macrophages during the whole regeneration process (MTZ 1). (d) Treatments were performed from 6 hpA to deplete late macrophages (MTZ 2). Fin images are representative overlays of mCherry-F fluorescence (red) with transmitted light acquisitions at 3 dpA. Scale bar=100 μm. Dotted lines outline the fin; dashed arrows indicate the position of the initial amputation. (c and e) Corresponding quantification of the regenerated fin length at 3 dpA in MTZ 1 (c) and MTZ 2 treatments (e) in indicated conditions (mean±S.E.M. from three independent experiments, ***P<0.001 and *P<0.05)
|
