
Fig. 1
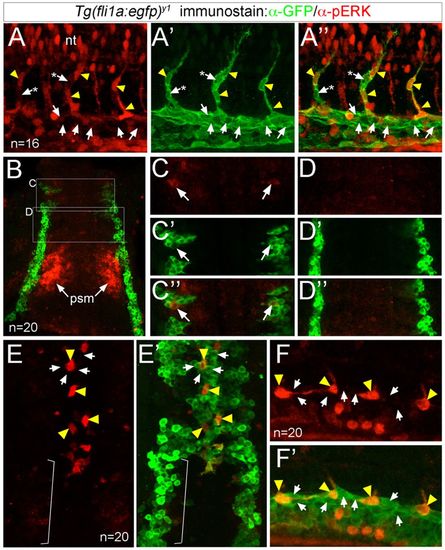
ERK is phosphorylated in sprouting ISV endothelial cells. (A-F′) Confocal images of endothelial cells in Tg(fli1a:egfp)y1 embryos immunostained to detect pERK (red) and GFP (green). Yellow arrowheads indicate pERK-positive endothelial cells, and arrows denote pERK-negative endothelial cells. In A-A″, asterisks denote pERK-negative endothelial cells in the ISV adjacent to pERK-positive cells. (A-A″) Embryo at 24 hpf showing pERK immunostaining (A), GFP immunostaining (A′), or an overlay of pERK and EGFP (A″). (B-D″) Embryo at 10 ss (dorsal view, anterior is up) showing pERK immunostaining (C,D), GFP immunostaining (C′,D′) and the overlay (B,C″,D″). Boxed regions in B indicate areas of higher magnification in C-D″. ERK staining in the presomitic (psm) mesoderm is indicated. (E,E′) Embryo at 18 ss (dorsal view, anterior is up) showing pERK immunostaining (E), and an overlay of pERK and GFP immunostaining (E′). Bracket indicates endothelial cells that have not yet migrated to the midline and are pERK negative. (F,F′) Embryo at 20 ss (lateral view, anterior to the left, dorsal is up) showing pERK immunostaining (F) and an overlay of EGFP expression and pERK immunostaining (F′). Number of embryos analyzed is indicated. |
| Gene: | |
|---|---|
| Antibody: | |
| Fish: | |
| Anatomical Terms: | |
| Stage Range: | 10-13 somites to Prim-5 |