
Fig. 5
- ID
- ZDB-FIG-160602-15
- Publication
- McCarthy et al., 2016 - Pdgfra and Pdgfrb genetically interact during craniofacial development
- Other Figures
- All Figure Page
- Back to All Figure Page
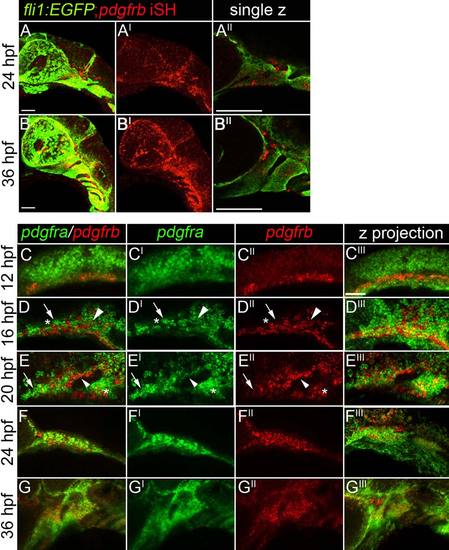
Neural crest cells express both pdgfra and pdgfrb. A-A′′: A 24 hpf fli1:EGFP transgenic embryo labeled for pdgfrb mRNA by means of fluorescence in situ hybridization, anterior is to the left. B-B′′: A 36 hpf fli1:EGFP transgenic embryo and labeled for pdgfrb mRNA by means of fluorescence in situ hybridization, anterior is to the left. C-G′′′: A 12 (C-C′′′), 16 (D-D′′2), 20 (E-E′′′), 24 (F-F′′′), 36 (G-G′′′) hpf embryo stained for both pdgfra and pdgfrb mRNA by means of fluorescence in situ hybridization. The neural crest expresses pdgfra (Eberhart et al., 2008), while pdgfrb is restricted medial and ventral to pdgfra expression at 12 hpf. At 16 hpf, cells singly positive for either pdgfra or pdgfrb are observed within the crest stream (D-D′′, arrow and asterisk, respectively). We also observe cells doubly positive within the stream (Arrowhead). More extensive co-expression of pdgfra and pdgfrb is observed at 20, 24, and 36 hr postfertilization (arrowheads in E-E′′). Scale bar = 20 µm. |
| Genes: | |
|---|---|
| Fish: | |
| Anatomical Terms: | |
| Stage Range: | 5-9 somites to Prim-25 |