
Fig. 1
- ID
- ZDB-FIG-160602-11
- Publication
- McCarthy et al., 2016 - Pdgfra and Pdgfrb genetically interact during craniofacial development
- Other Figures
- All Figure Page
- Back to All Figure Page
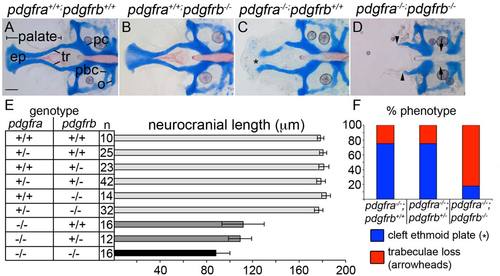
pdgfra and pdgfrb interact during craniofacial development. A-D: Five days postfertilization flatmounted zebrafish neurocrania. Anterior is to the left. A-C: Wild-type (A) and pdgfrb mutants (B) display normal craniofacial skeletons, while pdgfra mutants (C) display a shortened neurocrania and cleft palate (asterisk). D: pdgfra;pdgfrb double mutants lose the palatal skeleton (arrowheads) and a region of the parachordals adjacent to the posterior basicapsular commissure (arrows). E: Bar chart depicting neurocranial length measured from the anterior ethmoid plate to the posterior occipital arch of the neurocranium. Similarly shaded bars are not significantly different from one another (ANOVA, P ≤ 0.05). F: Bar chart depicting percent of phenotypes observed per genotype listed showing higher percentage of pdgfra-/-;pdgfrb-/- mutants displaying trabeculae loss, blue bar depicts cleft ethmoid plate (asterisk in C) and red bar depicts loss of trabeculae (arrowheads in D). ep, ethmoid plate; o, occipital arch; pbc, posterior basicapsular commissure; pc, parachordals; tr, trabeculae. Scale bar = 20 µm. |
| Fish: | |
|---|---|
| Observed In: | |
| Stage: | Day 5 |