
FIGURE
Fig. 4
- ID
- ZDB-FIG-160602-14
- Publication
- McCarthy et al., 2016 - Pdgfra and Pdgfrb genetically interact during craniofacial development
- Other Figures
- All Figure Page
- Back to All Figure Page
Fig. 4
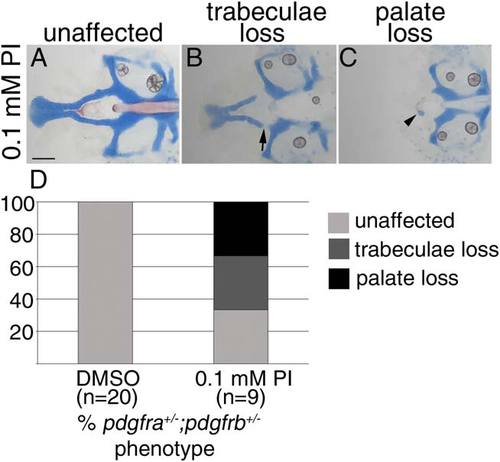
Craniofacial development is sensitive to Pdgf signaling loss between 10 and 30 hpf. A-C: Five dpf flatmounted pdgfra+/-;pdgfrb+/- zebrafish neurocrania, exposed to 0.1 mM Pdgf Inhibitor V (PI) from 10 to 30 hpf, anterior to the left. D: Bar chart depicting percentage of pdgfra+/-;pdgfrb+/- embryos displaying unaffected (light gray bar, A), trabeculae loss (dark gray bar, arrow in B), or palate loss (black bar, arrowhead in C) craniofacial defects in DMSO or 0.1 mM Pdgf Inhibitor V (PI). Scale bar = 20 µm. |
Expression Data
Expression Detail
Antibody Labeling
Phenotype Data
| Fish: | |
|---|---|
| Condition: | |
| Observed In: | |
| Stage: | Day 5 |
Phenotype Detail
Acknowledgments
This image is the copyrighted work of the attributed author or publisher, and
ZFIN has permission only to display this image to its users.
Additional permissions should be obtained from the applicable author or publisher of the image.
Full text @ Dev. Dyn.