
Fig. S10
- ID
- ZDB-FIG-160316-36
- Publication
- Xu et al., 2016 - Four and a Half LIM Domains 1b (Fhl1b) Is Essential for Regulating the Liver versus Pancreas Fate Decision and for β-Cell Regeneration
- Other Figures
- All Figure Page
- Back to All Figure Page
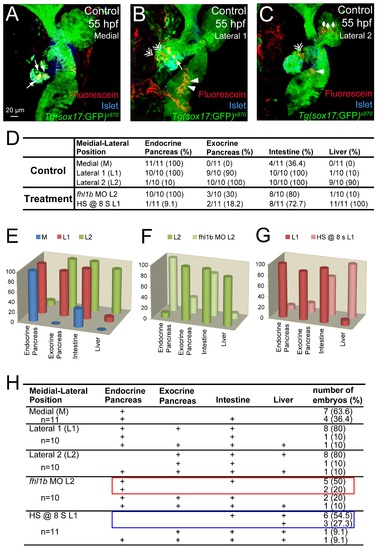
Endodermal progenitors contribute to distinct endodermal tissues based on their M-L position and the activity of Fhl1b. (A-C) Confocal images of Tg(sox17:GFP)s870 embryos at 55 hpf, stained for Islet (blue) and uncaged-Fluorescein (red), showing the progeny of the medial (A), lateral 1 (B) and lateral 2 (C) cells. Medial cells (A) mostly gave rise to pancreatic endocrine cells (white arrows). Lateral 1 cells (B) gave rise to pancreatic exocrine (white double arrows), endocrine (white arrow), and intestinal (white arrowheads) cells. Lateral 2 cells (C) gave rise to liver (white rhombi), intestine (white arrowhead), and pancreatic exocrine cells (white double arrow). (D-H) The numbers and the percentages of embryos that showed incorporation into a given tissue type in each specific position, comparing control embryos (D, E, F (as L2), G (as L1), and H) as well as fhl1b morphants and embryos induced to overexpress fhl1b at the 8-somite stage (D, F (as fhl1b MO L2), G (as HS @ 8s L1), and H). In every fhl1b-depleted embryo, lateral 2 cells contributed to the pancreatic endocrine cells (D, F (as fhl1b MO L2), and H), while in control embryos, most of the lateral 2 cells gave rise to the exocrine pancreas, intestine, and liver, but seldom gave rise to the endocrine pancreas (D, E, F (as L2), and H). In control embryos, lateral 1 cells mostly gave rise to pancreatic and intestinal cells, but not to liver cells (D, E, G (as L1), and H), whereas in every fhl1b-overexpressing embryo, lateral 1 cells contributed to the liver (D, G (as HS @ 8s L1), and H). Data in each 3-D column (%) in E-G were obtained by summing the number of embryos that showed incorporation into a given tissue type and normalizing it to the total number of embryos examined in each specific position: M, L1 and L2. Colored rectangles in H highlight the most dominant pattern in fhl1b morphants (red) and fhl1b-overexpressing (blue) embryos. A-C, confocal projection images, ventral views, anterior to the top. Scale bar, 20 µm. |