
Fig. S3
- ID
- ZDB-FIG-160316-29
- Publication
- Xu et al., 2016 - Four and a Half LIM Domains 1b (Fhl1b) Is Essential for Regulating the Liver versus Pancreas Fate Decision and for β-Cell Regeneration
- Other Figures
- All Figure Page
- Back to All Figure Page
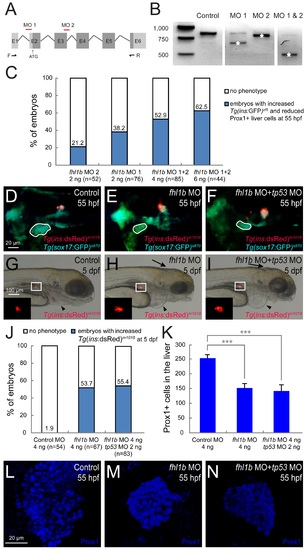
Specificity of fhl1b morpholinos. (A) Schematic diagram of fhl1b genomic structure and targeting positions of fhl1b MOs (red lines). Black arrows indicate the position of primers (F and R) used for RT-PCR analysis shown in (B). E1-E6: exon 1 to exon 6. Dark grey, coding regions; Light grey, untranslated regions. (B) RT-PCR analysis of fhl1b knockdown efficiency. Both MO 1 and MO 2 blocked the endogenous splice site of fhl1b and, as a result, either a deletion of exon 2 (MO 1, white asterisk) or a formation of a cryptic splice form of exon 3 (MO 2, white asterisk) occurred, while a combination of MO 1 and 2 led to deletion of both exon 2 and 3 (MO 1 & 2, white asterisk). (C) The percentages of embryos are given for each single MO or combination of MOs based upon the expression domain of Tg(ins:GFP)zf5 in the pancreas and Prox1 in the liver at 55 hpf. The embryos were scored as having a “reduced” or “increased” expression domain when the expression area of each marker was distinctly (> 25%) smaller or larger than that of the control embryos based upon the calculation using ImageJ. (D-F) Fluorescent images of Tg(ins:dsRed)m1018 and Tg(sox17:GFP)s870 expression showing that the developmental defects of the liver (white dotted circles) and β-cell formation in single fhl1b morphants (E) was comparable to double fhl1b/tp53 morphants (F) at 55 hpf (n = 52, control; n = 64, single fhl1b morphants; n = 72, double fhl1b/tp53 morphants). (G-I) Bright-field images combined with fluorescent images showing the overall morphology of embryos and Tg(ins:dsRed)m1018 expression (red) in control (G), single fhl1b morphants (H), and double fhl1b/tp53 morphants (I) at 5 dpf. The enlarged Tg(ins:dsRed)m1018 -expressing cell population (white squares and insets) in single fhl1b morphants (H) was similar to that in embryos co-injected with fhl1b and tp53 MOs (I). Note that potential off-target ventricle lumen inflation defects in the brain of single fhl1b morphants were attenuated by co-knockdown of tp53 (black arrows), whereas pericardial edema persisted both in single fhl1b morphants and double fhl1b/tp53 morphants (black arrowheads). (J) Quantification of the results in G-I. The embryos were scored as having an “increased” expression domain when the expression area of Tg(ins:dsRed)m1018 was distinctly (> 25%) larger than that of the control embryos based upon the calculation using ImageJ. (K) Quantification of the number (mean±SD) of Prox1-positive cells in the liver at 55 hpf. 252.6±11.5 cells were Prox1-positive in control embryos, while 151.3±16.2 and 142.3±17.4 cells expressed Prox1 in single fhl1b morphants and double fhl1b/tp53 morphants, respectively (P = 0.0009 and P = 0007, respectively). Cells in 20 planes of confocal images from 5 individual embryos were counted. Asterisks indicate statistical significance: ***, P < 0.001. (L-N) Confocal images of control embryos (L), single fhl1b morphants (M), and double fhl1b/tp53 morphants (N) at 55 hpf, stained for Prox1 (blue). The reduced Prox1-expressing cell population in single fhl1b morphants (M) was similar to that in embryos co-injected with fhl1b and tp53 MOs (N). D-F, dorsal views, anterior to the left. G-I, lateral views, anterior to the right. L-N, confocal projection images, ventral views, anterior to the top. Scale bars: D-F and L-N, 20 µM; G-I, 100 µM. |