
Fig. S7
- ID
- ZDB-FIG-160316-35
- Publication
- Xu et al., 2016 - Four and a Half LIM Domains 1b (Fhl1b) Is Essential for Regulating the Liver versus Pancreas Fate Decision and for β-Cell Regeneration
- Other Figures
- All Figure Page
- Back to All Figure Page
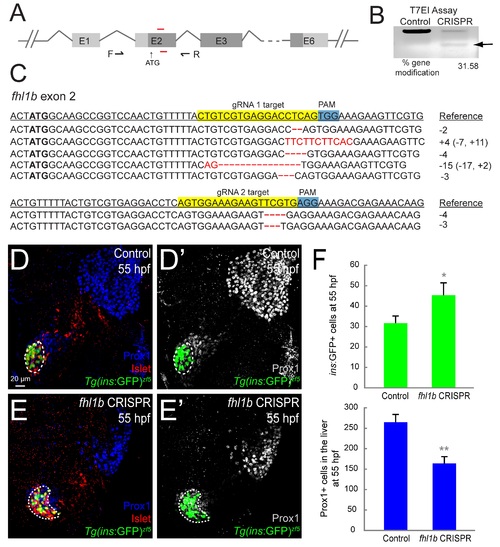
Cas9/gRNAs induces indels in the fhl1b locus in zebrafish. (A) Illustration showing the position of two gRNA-targeting sites (red lines) in the fhl1b locus in zebrafish. Black arrows indicate the position of primers (F and R) used for sequencing to identify indels shown in (C). (B) Representative T7EI assay showing the efficiency of Cas9-mediated cleavage in a single embryo at 55 hpf. (C) Representative Sanger sequencing results of the PCR amplicons of 4 individual embryos at 55 hpf, showing indels induced by Cas9/gRNA in the targeted fhl1b locus. Twenty to thirty clones were sequenced for each embryo. The wild-type sequence is shown at the top with the target sites highlighted in yellow and the PAM sequences (TGG and AGG) highlighted in blue. Deletions are shown as red dashed lines and insertions are highlighted in red. The net change in length caused by each indel is to the right of each sequence (+, insertion; -, deletion). (D-E′) Confocal images of Tg(ins:GFP)zf5 control embryos (D and D′) and Cas9/gRNA-induced mutant embryos (E and E′) at 55 hpf, stained for Prox1 (blue in D and E; grey in D′ and E′) and Islet (red; expression in the dorsal pancreatic bud is outlined by white dotted circles). Cas9/gRNA-induced mutant embryos exhibited an enlarged Insulin-expressing β-cell population with a reduced number of Prox1-positive cells in the liver, phenocopying that of the fhl1b MO knockdown embryos. (F) Quantification of the number (mean±SD) of Insulin-positive cells in the pancreas (green) and Prox1-positive cells in the liver (blue) at 55 hpf. 31.6±3.5 cells were Insulin-positive in control embryos, whereas 45.3±6.0 cells expressed Insulin in Cas9/gRNA-induced mutant embryos. 164±16.5 cells expressed Prox1 in Cas9/gRNA-induced mutant embryos, while 265±18.6 cells were Prox1-positive in control embryos. Cells in 20 planes of confocal images from 5 individual embryos were counted. Asterisks indicate statistical significance: *, P < 0.05, **, P < 0.01. D-E′, confocal projection images, ventral views, anterior to the top. Scale bar, 20 µm. |