
Fig. 6
- ID
- ZDB-FIG-160114-2
- Publication
- Wang et al., 2015 - First quantitative high-throughput screen in zebrafish identifies novel pathways for increasing pancreatic β-cell mass
- Other Figures
- All Figure Page
- Back to All Figure Page
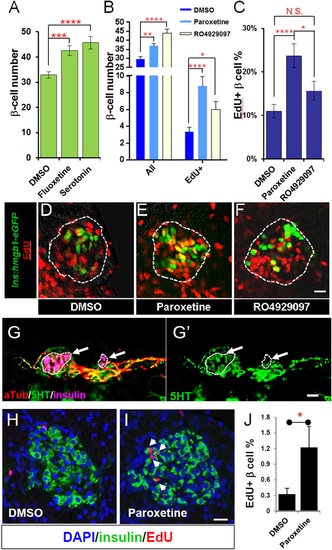
Serotonin signaling stimulates β-cell proliferation in a cell type-specific manner. (A) β-cell quantification following 25 µM serotonin or 25 µM fluoxetine treatment of ins:hmgb1-eGFP transgenic larvae from 3 to 5 dpf indicates enhanced serotonin signaling increases β-cell numbers in zebrafish larvae. (B) β-cell quantification in the principal islet (All) and the number of EdU-labeled β cells (EdU+) are plotted following treatments with EdU and either DMSO, 1 µM paroxetine, or 5 µM RO4929097. More β cells overall, and more EdU+ β cells, are observed with 1 µM paroxetine and 5 µM RO4929097 treatments, suggesting effects on β-cell proliferation. (C) Plot of EdU+ β cells as a percentage all β cells shows that paroxetine treatment stimulates β-cell proliferation, whereas Notch inhibition does not. Error bars, standard error. (D-F) Single-plane confocal fluorescence images of ins:hmgb1-eGFP islets (dashed lines) treated with EdU and either DMSO (D), 1 µM paroxetine (E), or 5 µM RO4929097 (F) - β cell nuclei (green); EdU+ cells (red); double-labled EdU+ β cells (yellow). Scale bar, 10 µm. n = 5-10 larvae per condition, experiment was repeated 3 times. (G, G2) Confocal images of immunostained adult zebrafish pancreas indicate that serotonin signaling is active in islets (white arrows, islets indicated by dashed lines). aTub: acetylated tubulin (red); 5HT (5-hydoxytryptamine): serotonin (green); insulin (magenta). Scale bar, 10 µm. (H, I) Confocal images of adult zebrafish pancreas following injections with EdU and either DMSO (H) or 1 mM paroxetine (I), and immunostained as indicated. (J) Plot of EdU+ β cells as a percentage all β cells shows that paroxetine treatment stimulates β-cell proliferation in adult zebrafish. Error bars, standard deviation. n = 3-5 adult fish per condition, experiment was repeated 3 times. All p-values were calculated using Dunnett′s test. *p < 0.05, **p < 0.01, ***p < 0.001, ****p < 0.0001. |
| Gene: | |
|---|---|
| Antibody: | |
| Fish: | |
| Conditions: | |
| Anatomical Terms: | |
| Stage Range: | Day 5 to Adult |
| Fish: | |
|---|---|
| Conditions: | |
| Observed In: | |
| Stage Range: | Day 5 to Adult |