
Fig. 3
- ID
- ZDB-FIG-151016-11
- Publication
- Wang et al., 2015 - First quantitative high-throughput screen in zebrafish identifies novel pathways for increasing pancreatic β-cell mass
- Other Figures
- All Figure Page
- Back to All Figure Page
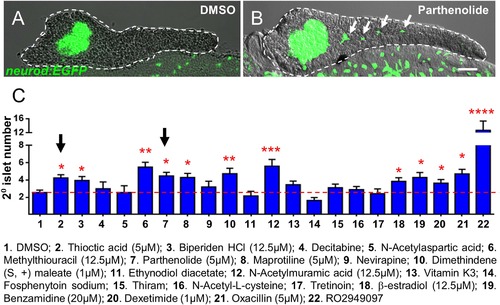
Validation of endocrine differentiation induction: precocious 2° islet assay. (A, B) Representative confocal images - brightfield and fluorescence images merged - of dissected pancreata (dashed lines) from neurod:EGFP transgenic larvae treated from 3 to 5 dpf with 0.1% DMSO (A) or a Hit I drug (B, example shown is parthenolide). Early endocrine cells are labeled with GFP (green) allowing precocious formation of 2° islets (white arrows) to be visualized following drug exposures. (C) The number of precocious 2° islets was quantified following treatment with the indicated Hit I compounds from 3 to 5 dpf. Results obtained with the optimal concentration were plotted relative to negative (0.1% DMSO) and positive controls (RO2949097, 5 µM). Of 20 Hit I compounds tested, 11 were confirmed as Lead I drugs for inducing endocrine differentiation (optimal concentrations for validated leads are shown in parentheses). Arrows indicate drugs that inhibit NF-κB signaling. Scale bar, 25 µm. Error bars, standard error. All p-values were calculated using Dunnett′s test. *p < 0.05, **p < 0.01, ***p < 0.001, ****p < 0.0001. n = 5–10 larvae per condition, experiment was repeated 3 times per compound. |
| Gene: | |
|---|---|
| Fish: | |
| Condition: | |
| Anatomical Term: | |
| Stage: | Day 5 |
| Fish: | |
|---|---|
| Condition: | |
| Observed In: | |
| Stage: | Day 5 |