
Fig. 3, S2
- ID
- ZDB-FIG-151016-10
- Publication
- Wang et al., 2015 - First quantitative high-throughput screen in zebrafish identifies novel pathways for increasing pancreatic β-cell mass
- Other Figures
- All Figure Page
- Back to All Figure Page
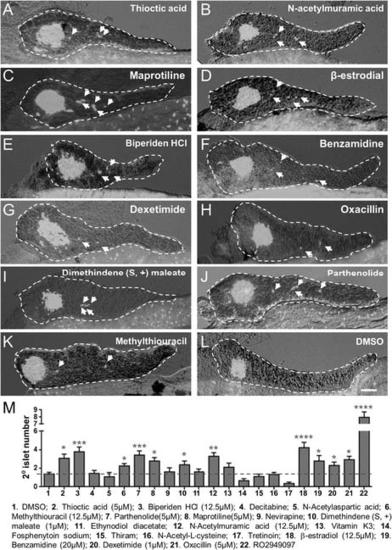
Validation of endocrine differentiation induction: precocious 2° islet assay (pax6b reporter). Precocious 2° islet assays were performed as per Figure 3. (A-L) Representative confocal images - brightfield and fluorescence images merged - of dissected pancreata (dashed lines) from pax6b:EGFP transgenic larvae treated with indicated Lead I compounds (at optimal concentrations) from 3 to 5 dpf: (A) Thioctic acid (5 µM); (B) N-acetylmuramic acid (12.5 µM); (C) Maprotiline (5 µM); (D) β-estradiol (12.5 µM); (E) Biperiden HCl (12.5 µM); (F) Benzamidine (20 µM); (G) Dexetimide (1 µM); (H) Oxacillin (5 µM); (I) Dimethindene (S, +) maleate (1 µM); (J) Parthenolide (5 µM); (K) Methylthiouracil (12.5 µM). Secondary islets are indicated by arrows. (M) The number of precocious 2° islets was quantified following treatment with the indicated Hit I compounds from 3 to 5 dpf. Results obtained with the optimal concentration were plotted relative to negative (0.1% DMSO) and positive controls (RO2949097, 5 µM). The same 11 Lead I compounds validated with the neurod:GFP reporter line (Figure 3, Figure 3 - figure supplement 1, Table 1) showed significant results - albeit producing fewer numbers of 2° islets than the neurod:EGFP line. Scale bar, 25 µm. All p-values were calculated using Dunnett′s test. *p < 0.05, **p < 0.01, ***p < 0.001, ****p < 0.0001. n = 5-10 larvae per condition, experiment was repeated 3 times per compound. |