
Fig. 3, S1
- ID
- ZDB-FIG-151016-9
- Publication
- Wang et al., 2015 - First quantitative high-throughput screen in zebrafish identifies novel pathways for increasing pancreatic β-cell mass
- Other Figures
- All Figure Page
- Back to All Figure Page
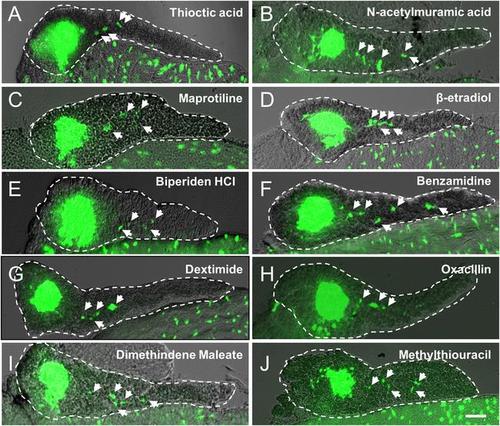
Validation of endocrine differentiation induction: precocious 2° islet assay (neurod reporter). Precocious 2° islet assays were performed as per Figure 3. (A-J) Representative confocal images - brightfield and fluorescence images merged - of dissected pancreata (dashed lines) from neurod:EGFP transgenic larvae treated with indicated Lead I compounds (at optimal concentrations) from 3 to 5 dpf: (A) Thioctic acid (5 µM); (B) N-acetylmuramic acid (12.5 µM); (C) Maprotiline (5 µM); (D) β-estradiol (12.5 µM); (E) Biperiden HCl (12.5 µM); (F) Benzamidine (20 µM); (G) Dexetimide (1 µM); (H) Oxacillin (5 µM); (I) Dimethindene (S, +) maleate (1 µM); (J) Methylthiouracil (12.5 µM). Secondary islets are indicated by arrows. Scale bar, 25 µm. |