
Fig. 2, S1
- ID
- ZDB-FIG-151016-8
- Publication
- Wang et al., 2015 - First quantitative high-throughput screen in zebrafish identifies novel pathways for increasing pancreatic β-cell mass
- Other Figures
- All Figure Page
- Back to All Figure Page
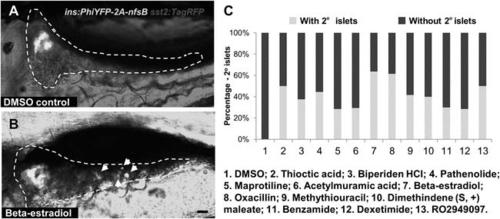
Observation of 2o islet formation in live β/δ-reporter larvae after drug treatment. (A, B) Representative in vivo confocal images - brightfield and fluorescence images merged-of pancreata in β/δ-reporter larvae following treatment with 0.1% DMSO (A) or a representative Hit I drug (B, Beta-estradiol) from 3 to 7 dpf. White arrows indicate 2° islets in the tail of the pancreas. Scale bar = 25 µm. (C) Percentages of larvae having 2° islets following treatment from 3 to 7 dpf with the indicated control of Hit I compounds at optimal concentrations. n > 20. negative control: 0.1% DMSO. Positive control: RO2949097 (5 µM). |