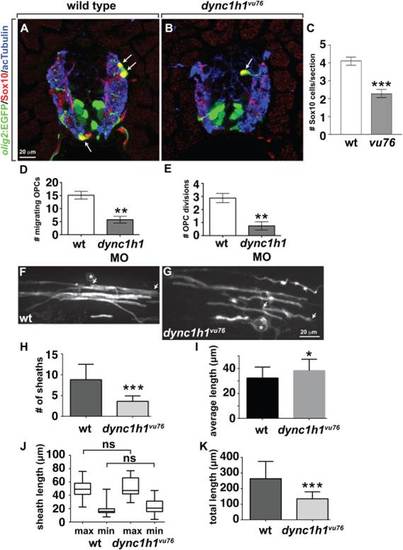
Dync1h1 deficient zebrafish have a deficit of oligodendrocytes, each of which has fewer myelin sheaths. A,B: Immunohistochemistry to detect Sox10 (red) in combination with olig2:EGFP (green) marks oligodendrocyte lineage cells in 4 dpf wild-type and dync1h1vu76 mutant larvae. Panels show representative images of transverse sections through the trunk spinal cord, with dorsal up. Anti-acetylated Tubulin staining (blue) marks axons. C: Mutant larvae have approximately 50% the normal number of oligodendrocyte lineage cells. D,E: Data, collected from time-lapse movies, showing fewer dorsally migrating OPCs and fewer OPC divisions in dync1h1 MO-injected larvae than in wild-type. F,G: Representative images of single, sox10:EGFP-CaaX+ oligodendrocytes in 6 dpf control (F) and dync1h1vu76 mutant (G) larvae. Asterisks mark cell bodies and arrows mark ends of single myelin sheaths. H: Quantification revealed fewer sheaths in dync1h1vu76 mutant larvae than in control. I: Graph showing that average myelin sheath length is slightly longer in dync1h1vu76 mutant larvae than in wild-type. However, the statistical significance of the difference is weak (P = 0.0414). J: Box-and-whisker plot revealed that both the minimum (min) and maximum (max) lengths of sheaths in dync1h1vu76 mutant larvae were slightly more variable than in control larvae. However, the differences between the average maximum and minimum lengths were not significant (ns). K: Graph showing the average total myelin sheath lengths of individual oligodendrocytes. Error bars represent ± SEM. For panels H–K, wild-type data were collected from 28 cells in 11 larvae. Mutant data were collected from 15 cells in 9 larvae. Statistical significance was determined by Student′s t-test for panels C–E and by nonparametric two tailed Mann-Whitney t-test for panels H–K. ***P < 0.0001; **P < 0.001; *P < 0.05.
|
