
Fig. 6
- ID
- ZDB-FIG-150428-6
- Publication
- Yang et al., 2015 - CNS Myelination Requires Cytoplasmic Dynein Function
- Other Figures
- All Figure Page
- Back to All Figure Page
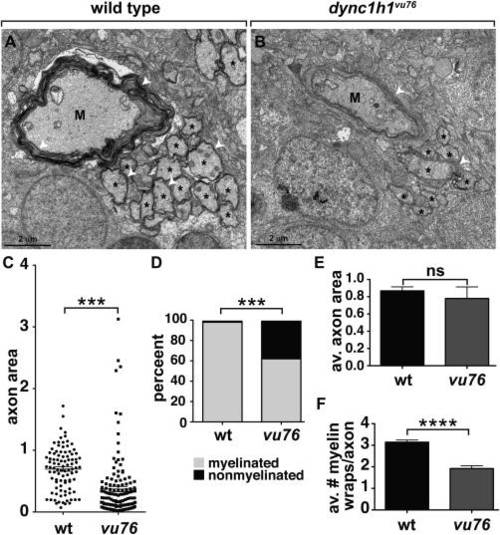
Loss of Dync1h1 function causes CNS axon and myelin abnormalities. A,B: EM micrographs of ventral spinal cords of 6 dpf wild-type and dync1h1vu76 mutant larvae. M indicates Mauthner axon, asterisks indicate intermediate sized axons and white arrowheads mark myelin membrane. C: Scatter plot showing cross sectional area of axons. Mauthner axons were excluded from the plot. The average area of axons in mutant larvae is reduced relative to wild-type. D: Graph showing percentage of myelinated, intermediate size axons at 6 dpf. Intermediate was defined as axons having a cross sectional area between 0.201 and 3.99 µm. Loss of Dync1h1 function results in more nonmyelinated axons. E: Graph showing the average axon cross sectional area of intermediate class myelinated axons. F: Graph showing the average number of myelin wraps on intermediate class myelinated axons. Statistical analysis for the proportion of myelinated and nonmyelinated axons was performed using a two-sided Chi-square test. Statistical analysis for axon area and myelin wraps was performed using two-tailed, unpaired t-test. ***P < 0.0005, ****P < 0.0001. ns, not significant. Error bars represent + SEM. |
| Fish: | |
|---|---|
| Observed In: | |
| Stage: | Day 6 |