
FIGURE
Fig. S4
Fig. S4
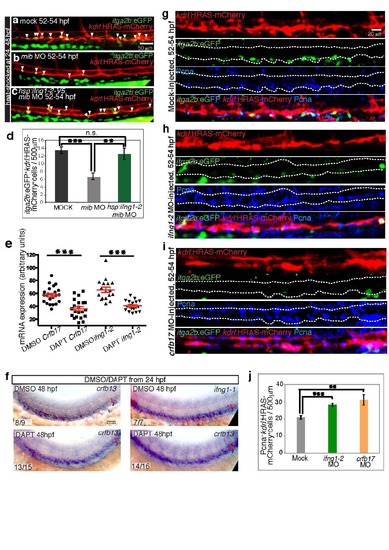
Ifn-γ acts downstream of Notch during HSC emergence, related to fig. 4. a-d) HSC deficiency in mib morphants is rescued by Ifng1-2 overexpression. HSCs in embryos not harboring the Tg(hsp:ifng1-2-V5) transgene, injected with mock (a), mib MO (b) and Tg(hsp:ifng1-2-V5) embryos injected with mib MO (c) are labeled by Tg(itga2b:EGFP) (green) and Tg(kdrl:HRAS-mCherry) (red) expression and marked by white arrowheads. d, HSCs per 500 µm dorsal aorta length. Values represent means +/- SEM. n=18- 33 embryos per group. ** p d 0.01, *** p d 0.001, n.s. not significant. e) Notch inhibition downregulates crfb17 and ifng1-2 expression. crfb17 and ifng1-2 transcripts assessed by in situ hybridization (Fig. 4n-q) were quantified as mean grey values. Red bars show mean+/- SEM. n=21-36 embryos per group. *** p d 0.001. f) Notch signaling inhibition does not appear to affect crfb13 or ifng1-1 expression. crfb13 and ifng1-1 expression in the AGM region of 36-38 hpf embryos treated with DMSO or DAPT starting at 24 hpf. The number of embryos showing the representative phenotype per total number of embryos observed is indicated in the lower left corner. Red brackets identify the dorsal aorta (DA), blue brackets identify the cardinal vein (CV). g-j) Ifn-γ signaling deficiency increases EC cycling rate. kdrl:HRAS-mCherry+ ECs (red) that exit the G0 phase, were marked by PCNA immunostaining (blue), in embryos injected with mock (g), ifng1-2 MO (h) and crfb17 MO (i). Reduction in the number of itga2b:EGFP+ HSCs (green) and, conversely, induction of PCNA+ cells within the dorsal aorta region, indicated by dashed lines, is evident in both ifng1-2 and crfb17 morphants. j. PCNA+ ECs per 500 µm dorsal aorta length. Values represent means +/- SEM. n=9-12 embryos per group. ** p d 0.01, *** p d 0.001. All images are lateral views, dorsal up and anterior to the left. |
Expression Data
| Genes: | |
|---|---|
| Antibody: | |
| Fish: | |
| Conditions: | |
| Knockdown Reagents: | |
| Anatomical Terms: | |
| Stage Range: | Prim-25 to Long-pec |
Expression Detail
Antibody Labeling
Phenotype Data
| Fish: | |
|---|---|
| Condition: | |
| Knockdown Reagents: | |
| Observed In: | |
| Stage: | Long-pec |
Phenotype Detail
Acknowledgments
This image is the copyrighted work of the attributed author or publisher, and
ZFIN has permission only to display this image to its users.
Additional permissions should be obtained from the applicable author or publisher of the image.
Reprinted from Developmental Cell, 31, Sawamiphak, S., Kontarakis, Z., Stainier, D.Y., Interferon Gamma Signaling Positively Regulates Hematopoietic Stem Cell Emergence, 640-653, Copyright (2014) with permission from Elsevier. Full text @ Dev. Cell