
FIGURE
Fig. 5
- ID
- ZDB-FIG-141023-2
- Publication
- Gupta et al., 2013 - Identification and expression analysis of zebrafish glypicans during embryonic development
- Other Figures
- All Figure Page
- Back to All Figure Page
Fig. 5
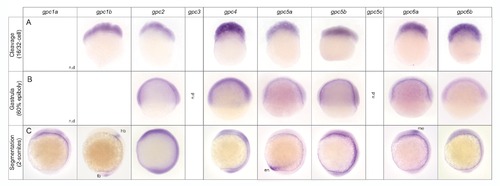
Spatial expression of zebrafish glypicans during cleavage to early segmentation stages. In situ hybridization was performed to detect glypican mRNA during early developmental stages. Lateral views with anterior to the top (A, B, C) and dorsal to the right (B, C). Developmental stages and gene names are indicated. tb, tailbud; hb, hindbrain; en, endoderm; me, mesencephalon; n.d: not detected. |
Expression Data
| Genes: | |
|---|---|
| Fish: | |
| Anatomical Terms: | |
| Stage Range: | 64-cell to 1-4 somites |
Expression Detail
Antibody Labeling
Phenotype Data
Phenotype Detail
Acknowledgments
This image is the copyrighted work of the attributed author or publisher, and
ZFIN has permission only to display this image to its users.
Additional permissions should be obtained from the applicable author or publisher of the image.
Full text @ PLoS One