
Fig. 1
- ID
- ZDB-FIG-140515-2
- Publication
- Weber et al., 2014 - Mitotic Position and Morphology of Committed Precursor Cells in the Zebrafish Retina
- Other Figures
- All Figure Page
- Back to All Figure Page
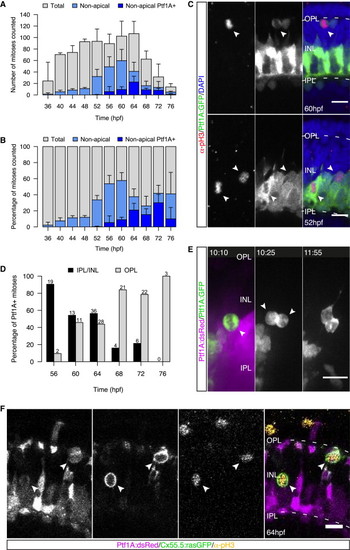
HC Precursors Divide at Multiple Positions but Do Not Account for All Nonapical Divisions (A) Total number of pH3+ cells (gray), nonapically dividing cells (light blue), and Ptf1A+ nonapically dividing cells (dark blue) counted at each time point/embryo. Error bars represent SD; n = 2–6 embryos per time point. (B) Data from (A) as percentage of all counted mitoses. Error bars represent SD. (C) Ptf1A:GFP (green) embryos stained for pH3 (red) and DAPI (blue). Ptf1A+/pH3+ cells are found adjacent to the OPL (top, arrows) and within the AC layer (bottom, arrows). (D) Quantification of the location of Ptf1A+/pH3+ cells as percentage of pH3+ cells. Numbers on top of bars indicate number of dividing cells counted. n = 3 embryos/time point, pooled. (E) INL division of a Ptf1A:GFP cell gives rise to two Ptf1A+ daughters (arrows). Time in hr:min. Imaging started at 46 hpf. (F) pH3 staining (yellow) of a Ptf1a:dsRed/Cx55.5:rasGFP (magenta/green) embryo. All cells in the INL and adjacent to the OPL immunoreactive for pH3 express Ptf1A:dsRed and Cx55.5:rasGFP (arrows). Scale bars represent 10 μm. See also Figure S1 and Movie S1. |