|
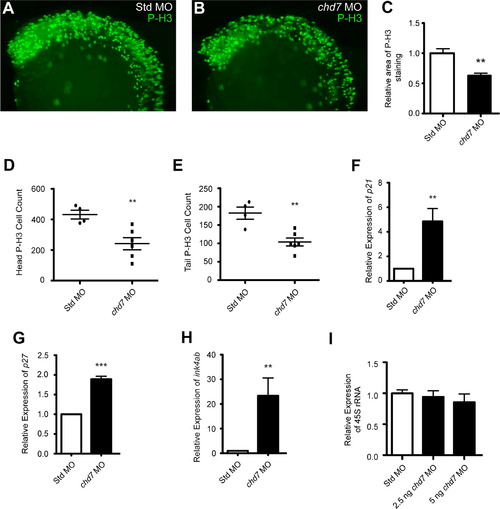
chd7 targeting impairs cell proliferation. (A–B) Lateral views of representative P-H3 stained zebrafish morphants at 25 hpf. (C) Quantification of the area occupied by P-H3 positive cells in chd7 morphants relative to P-H3 positive cells in Std morphants (n=5–6). (D–E) Graphs of P-H3 positive cell counts taken from confocal images of both the head and tail regions of Std and chd7 morphants (n=4–6). (F–H) Graphs of qRT-PCR data measuring gene expression of several cell cycle regulator genes at 25 hpf in chd7 morphants relative to Std morphants (n=5–6). (I) Expression of pre-rRNA in chd7 morphants at two separate morpholino dosages relative to Std morphants at 8 hpf (n=3). All error bars represent SEM. Significance for all graphs was determined with a Student′s two-tailed t-test and significant values are noted p<0.01 (**) and p<0.001 (***).
|