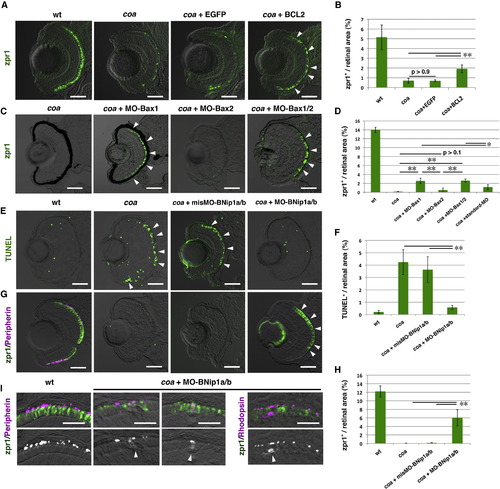
Photoreceptor Degeneration in the coa Mutant Depends on BNip1 (A) Zpr1 labeling (green) of 84 hpf WT, coa mutants, coa mutants injected with egfp mRNA, and bcl2 mRNA. Arrowheads indicate rescued photoreceptors. (B) Percentage of zpr1-positive areas relative to the total retinal area in the experiments shown in (A). Green and black bars indicate the mean and SD, respectively. **p < 0.01. (C) Zpr1 labeling (green) of 84 hpf coa mutant and coa mutants injected with MO-Bax1, MO-Bax2, or a mixture of MO-Bax1 and MO-Bax2. Arrowheads indicate rescued photoreceptors. (D) Percentage of zpr1-positive areas relative to the total retinal area in the experiments shown in (C) as well as in a coa mutant injected with the standard MO. Green and black bars indicate the mean and SD, respectively. **p < 0.01 and *p < 0.05. (E) TUNEL staining (green) of 84 hpf WT, coa mutant, coa mutant retinas injected with misMO-BNip1a/b, and a mixture of MO-BNip1a and MO-BNip1b. Arrowheads indicate apoptosis in the ONL. (F) Percentage of TUNEL-positive areas relative to the total retinal area in the experiments shown in (E). Green and black bars indicate the mean and SD, respectively. **p < 0.01. (G) Zpr1 labeling (green) and GFP-tagged peripherin (magenta) in 84 hpf WT, coa mutant, coa mutant retinas injected with misMO-BNip1a/b or a mixture of MO-BNip1a and MO-BNip1b. Arrowheads indicate rescued photoreceptors. Nonspecific zpr1 signal was observed in the lens. (H) Percentage of zpr1-positive areas relative to the total retinal area in the experiments shown in (G). Green and black bars indicate the mean and SD, respectively. **p < 0.01. (I) Zpr1 labeling (green) and GFP-tagged peripherin or rhodopsin (magenta) in the photoreceptor cell layer in WT and coa mutants injected with MO-BNip1a and MO-BNip1b. Lower panels show the magenta channel. Arrowheads indicate the failure of transport to the OS.The numbers of retinal sections used in the experiments shown in (B), (D), (F), and (H) and p values for the t test are shown in Table S2. Scale bars, 50 μm (A, C, E, and G) and 10 μm (I). See also Figures S3 and S4.
|
