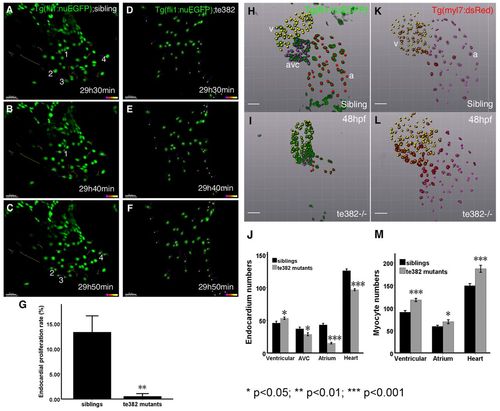
Atrial Tg(fli1:nuEGFP) endocardial numbers were reduced while ventricular cardiomyocyte numbers were increased in scote382 mutant embryos. (A–F) Endocardial nuclei were labeled by Tg(fli1:nuEGFP) in wild-type (wt) (A–C) and scote382 mutant (D–F) embryos at 29hours 30minutes, 29hours 40minutes and 29hours 50minutes post fertilization. A representative set of time-lapse images showed one divided cell from 29hours 30minutes to 29hours 40minutes (1 in B), and three divided cells from 29hours 40minutes to 29hours 50minutes (2, 3 and 4 in C) in wild-type Tg(fli1:nuEGFP) embryos. Note that there were no divided cells from 29hours 30minutes to 29hours 50minutes in scote382 mutant embryos (D–F). (G) The endocardial proliferation rate (proliferating endocardium from 29 to 36hpf to the total endocardium at 29hpf) in scote382 was very low, compared with their siblings. n = 3; mean±s.e.m.; Student′s t-test. (H-J) The endocardium, labeled by Tg(fli1:nuEGFP), was divided into ventricular, AVC and atrial parts. Note fewer endocardial cells in the mutant AVC and atrium (I-J). (K-M) Myocardial nuclei were labeled by Tg(myl7:nuDsRed). Note more cardiomyocytes in the mutant ventricle (L-M). (J,M) n = 8–12; mean±s.e.m.; Student′s t-test. Scale bars: 30μm (A-F); 50μm (H-L).
|
