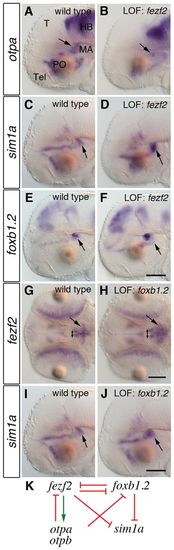
Genetic interactions among fezf2, otp, sim1a and foxb1.2. (A-J) WISH of 2-dpf wild-type zebrafish embryos (A,C,E,G,I) and embryos injected with 4 ng fezf2 MO (B,D,F) or 8 ng foxb1.2 MO (H,J) to detect changes in the expression of otpa, sim1a, foxb1.2 and fezf2. Lateral (A-F,I,J) and dorsal (G,H) views are shown. (A,B) The expression of otpa is reduced in the MA in fezf2 morphants (B, arrows; n=11/14). (C,D) In the MA, sim1a is expanded in fezf2 morphants (D, arrow; n=19/19). (E,F) The loss of Fezf2 activity results in an expansion of the foxb1.2 domain (F, arrows; n=32/32). (G,H) The expression of fezf2 in foxb1.2 morphants is expanded in the anterior (double-headed arrows) and posterior MA (H, arrows; n=19/25). (I,J) Also the expression of sim1a in foxb1.2 morphants is expanded (J, arrow; n=12/12). The same wild-type image is shown in C and I for the purposes of direct side-by-side comparison with morphants; the in situs for C/I, D and J were all conducted in parallel. (K) Summary of the observed genetic interactions. T, tectum; Tel, telencephalon; PO, preoptic area; MA, mammillary area; HB, hindbrain; LOF, loss-of-function. Scale bar: 100 μm.
|
