
Fig. 2
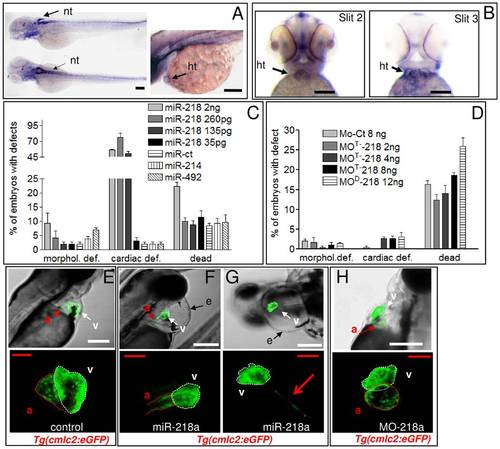
miR-218 over-expression affects cardiac development. A, miR-218a ISH of 72 hpf embryos. B, slit2 and slit3 ISH of 48 hpf embryos. nt, neural tube; ht, heart. C,D, phenotypes induced at 72 hpf by increasing doses of miR-218 mimic (C) or MOM/MOD-218 (D) injection. The percentage of embryos with the indicated defects was averaged across multiple independent experiments carried out in double blind. The total numbers of embryos analyzed were as follows: Ct miRNA (1 ng) n = 293; miR-214 mimic (1 ng) n = 104; miR-492 mimic (1 ng) n = 103; miR-218 mimic (35 pg) n = 107; miR-218 mimic (135 pg) n = 180; miR-218 mimic (260 pg) n = 318; miR-218 mimic (2 ng) n = 180; MO-Ct (8 ng) n = 207; MOD-218 (12 ng) n = 323; MOM-218 (2 ng) n = 112; MOM-218 (4 ng) n = 165; MOM-218 (8 ng) n = 182. E-H, phenotypic analysis of miR-218a misregulation in Tg(cmlc2:eGFP) embryos. Confocal images of representative transgenic embryos showing the presence or the absence of pericardial edema (e;top) and heart morphology (bottom). F,G examples of heart defects with different degrees of severity. a, atrium, v, ventricle, e, cardiac edema. Dotted lines encircle ventricle (white) or atrium (red). Red arrow in G (bottom panel) indicates a shrunken, elongated ventricle typical of the heartstring phenotype. Scale bars: white or black 100 μm, red 25 μm. |
| Genes: | |
|---|---|
| Fish: | |
| Anatomical Terms: | |
| Stage: | Long-pec |