
Fig. 3
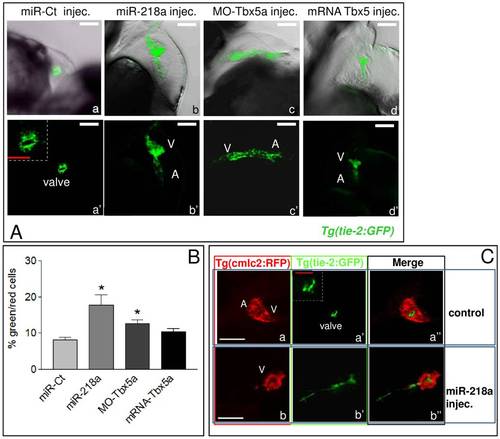
miR-218a over-expression leads to the expansion of tie-2 expression. A, confocal images of 72 hpf Tg(tie-2:GFP) embryos injected with 260 ng of control miRNA (a,a′), 260 ng of miR-218a mimic (b,b′), 2 ng of MO-Tbx5a (c,c′) or 100 pg of mRNA Tbx5a (d,d′). A, magnification of the control valve is shown in the inset in panel a′. Labels: A, atrium, V, ventricle. B, FACS analysis of cells dissociated from 72 hpf Tg(tie-2:GFP-cmlc2:eRFP) embryos injected as described in A. C, confocal images of 72 hpf Tg(tie-2:GFP-cmlc2:eRFP) embryos injected with 260 ng of miR-Ct (top) or with miR-218a mimic (bottom). The control valve is magnified in the inset in panel a2. White scale bars: 100 μm, red scale bars 25 μm. |