
Fig. 6
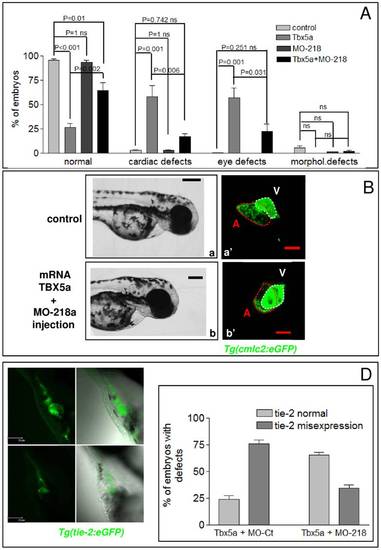
Down-regulation of miR-218 can rescue the defects generated by tbx5 over-expression. A, quantification of the phenotypes induced by the injection of 100 pg of tbx5a mRNA (n = 199), 8 ng of MOD-218 (n = 182) or by the co-injection of 100 pg of tbx5a mRNA and 8 ng of MOD-218 (n = 241). As control, non injected embryos were quantified. Each experimental point in the graph represents the mean ± SE of at least three independent experiments. Comparisons between groups were performed by one-way analysis of variance, followed by Bonferroni’s post-hoc for multiple comparisons. B, phase-contrast and confocal images of representative transgenic Tg(cmlc2:eGFP) embryos at 72 hpf comparing the phenotype of a control embryo (upper panels) to the rescued phenotype generated by the co-injection of 100 pg of tbx5a mRNA and 8 ng of MOD-218 (lower panels). C, quantification of tie-2 mis-expression in 72 hpf Tg(tie-2:GFP) embryos after the co-injection of tbx5a mRNA (100 pg) and MO-Ct (8 ng, n = 60) or of tbx5a mRNA (100 pg) and MOD-218 (8 ng, n = 62). D, Confocal images of representative 72 hpf Tg(tie-2:GFP) embryos co-injected with tbx5a mRNA and MO-Ct (a-a2) or with tbx5a mRNA and MOD-218 (b-b2). Labels: A, atrium, V, ventricle. Scale bars: black 100 μm, red 25 μm. |