Fig. S9
- ID
- ZDB-FIG-120405-30
- Publication
- Jao et al., 2012 - A zebrafish model of lethal congenital contracture syndrome 1 reveals Gle1 function in spinal neural precursor survival and motor axon arborization
- Other Figures
- All Figure Page
- Back to All Figure Page
|
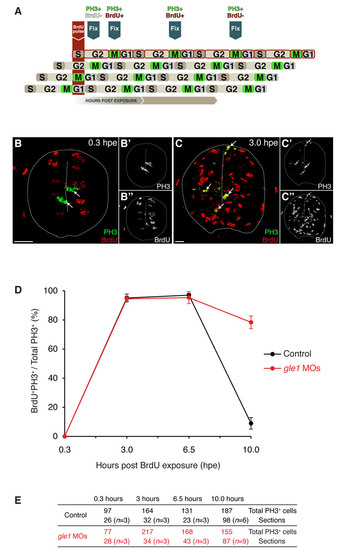
Spinal neural precursors fail to exit the cell cycle efficiently upon Gle1 depletion. (A) Schematic of the ′percent labeled mitoses′ (PLM) paradigm. A 45-minute BrdU pulse marks S-phase neural precursors, which then progress through the cell cycle over time. Detection of M-phase cells with anti-phosphohistone H3 (PH3) antibody identifies cells that were in S phase (PH3+ BrdU+) or not in S phase (PH3+ BrdU-) at the time of BrdU exposure. (B-C22) Examples of transverse spinal cord sections showing PH3 staining (green) and BrdU incorporation (red) at 0.3 (B) and 3.0 (C) hours post-exposure (hpe). All M-phase cells were negative for BrdU labeling at 0.3 hpe (arrows in B). However, many S-phase cells have progressed to M phase within 3 hours and were detected by PH3/BrdU co-labeling (arrows in C). Single-channel images of PH3 (B2,C2) and BrdU (B22,C22) are shown on the right. Scale bars: 10 µm. (D,E) Plotting of PLM from 0.3 to 10 hpe (D). The embryos were at 26 hpf at the time of BrdU pulse. Before 32.5 hpf (6.5 hpe), the neural precursors progressed through the cell cycle at a similar rate between the controls and gle1 morphants (<3.5 hours for each full cell cycle). However, after 32.5 hpf, the cell cycle progression of the neural precursors in the controls has slowed down: after 3.5 hours (i.e. at the 10.0 hpe time point), fewer than 10% of cells reached M phase. By contrast, <80% of the neural precursors in the gle1 morphants still progressed through the cell cycle and reached the next M phase at 10.0 hpe. These results indicate that Gle1-deficient neural precursors fail to exit the cell cycle efficiently. Co-labeling of PH3/BrdU was examined manually in single confocal optical sections (< 1 μm). Values are graphed as mean ± s.e.m. (E) Quantification of the sections containing PH3+ cells at different time points after BrdU exposure. n, number of embryos analyzed at each time point. |

