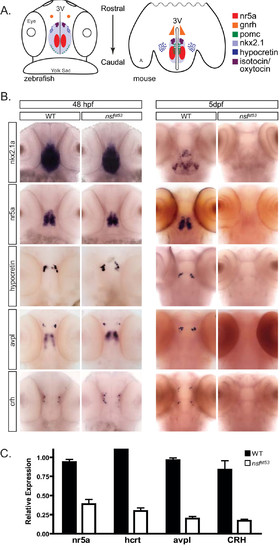
Loss of hypothalamic markers occurs during embryo-to-larva transition. (A) Cartoon depicting the spatial patterning of known hypothalamic markers in the zebrafish (48 hpf) and mouse (P0) brain. A dorsal view, ventral side down is shown for zebrafish and a horizontal plane is shown for mouse of several conserved hypothalamic transcription factors and neuropeptides. Other anatomical landmarks include the eyes, yolk sac, third ventricle (3V), and on the mouse cartoon, amygdala (A), (B) Whole mount expression patterns are shown for nkx2.1a, nr5a (ff1d), hcrt, avpl, and crh for both 48-hpf (n = 15) and 5-dpf (n = 20) wild-type (WT) and nsfst53 zebrafish. The expression of hypothalamic markers is lost by 5 dpf (right panel). The 48-hpf nsfst53 zebrafish were identified by genotyping. (C) Relative transcript levels of neuroendocrine markers are shown in wild-type and nsfst53 zebrafish heads at 5 dpf (n = 8 each). Fold induction is relative to 1.0 with results from a single wild-type head chosen for each primer set. Samples variation is shown by error bars (standard error of the mean).
|
