
FIGURE
Fig. 8
Fig. 8
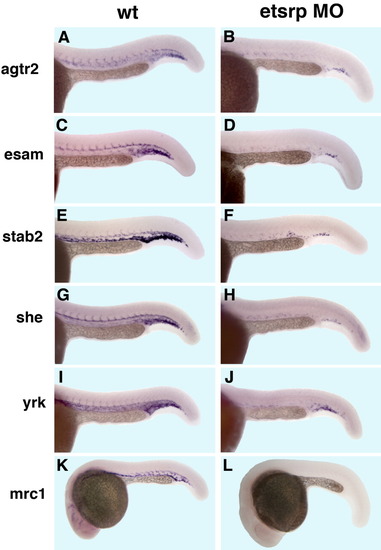
A-L: Expression of agtr2 (A,B), esam (C,D), stab2 (E,F), she (G,H), yrk (I,J), and mrc1 (K,L) in control uninjected embryos (A,C,E,G,I,K) and etsrp morphants (B,D,F,H,J,L). A-L: At 24 hours postfertilization (hpf), tail region (A-J); at 22 hpf (K,L). Note that expression of vascular endothelial markers is strongly down-regulated in etsrp morphants with only a few endothelial cells within the axial vessels and the tail plexus region present. |
Expression Data
| Genes: | |
|---|---|
| Fish: | |
| Knockdown Reagents: | |
| Anatomical Term: | |
| Stage Range: | 26+ somites to Prim-5 |
Expression Detail
Antibody Labeling
Phenotype Data
Phenotype Detail
Acknowledgments
This image is the copyrighted work of the attributed author or publisher, and
ZFIN has permission only to display this image to its users.
Additional permissions should be obtained from the applicable author or publisher of the image.
Full text @ Dev. Dyn.