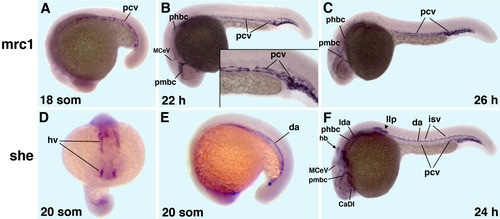
Vascular-endothelial expression of the zebrafish mannose receptor C1 (mrc1) and src homology 2 domain containing E (she) as analyzed by in situ hybridization. A-C,E,F: Lateral view, anterior to the left. D: Anterior view. A-C: mrc1 expression. D-F: she expression. A-F: 18-somite (A), 22 hours postfertilization (hpf; B), 26 hpf (C), 20-somite (D,E), 24 hpf (F) stage embryos. A-C: Note mrc1 expression in the posterior cardinal vein and venous head vessels. D-F: She expression is observed in the dorsal aorta, intersegmental and head vessels, the posterior cardinal vein plexus region, and weakly in the cardinal vein. In addition, she is expressed in the lateral line primordia (arrowhead, F) and a cluster of neural cells within the dorsal hindbrain (arrow, F). CaDI, caudal division of the internal carotid artery; hb, neural expression within the hindbrain; hv, head vessels; da, dorsal aorta; isv, intersegmental vessels; lda, lateral dorsal aorta; llp, lateral line primordia; MceV, middle cerebral vein; pcv, posterior cardinal vein; phbc, primordial hindbrain channel; pmbc, primordial midbrain channel.
|
