
Fig. 4
- ID
- ZDB-FIG-090106-6
- Publication
- Zhou et al., 2008 - Duplication of the IGFBP-2 gene in teleost fish: protein structure and functionality conservation and gene expression divergence
- Other Figures
- All Figure Page
- Back to All Figure Page
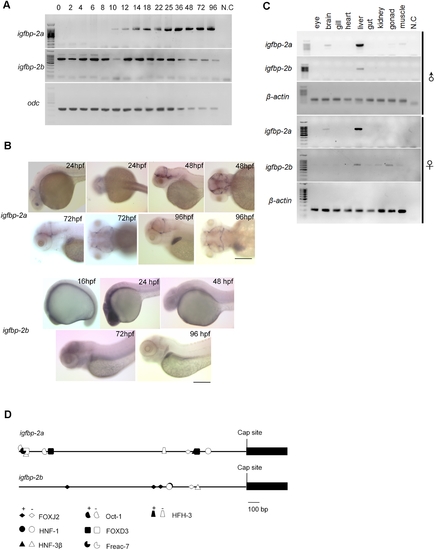
Temporal and spatial expression patterns of igfbp-2a and igfbp-2b. A) RT-PCR analysis result. The developmental stages are shown at the top, hpf, hour post fertilization. N.C., negative control. odc, (ornithine decarboxylase). B) In situ hybridization analysis of whole mounted embryos. Embryos of indicated stages were analyzed. Scale bar = 100 μm. C) Tissue distribution of igfbp-2a and igfbp-2b mRNA in male and female adult fish. D) Schematic diagram comparing the 5′-flanking region of igfbp-2a and igfbp-2b 2,000 bp before the cap site are shown. Close symbols indicate DNA binding elements in forward orientation and open symbols indicate those in reverse orientation. |
| Genes: | |
|---|---|
| Fish: | |
| Anatomical Terms: | |
| Stage Range: | 1-cell to Adult |