
Fig. 5
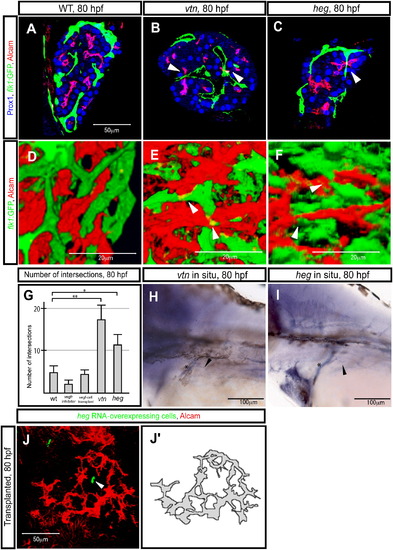
The heart of glass Gene Regulates Hepatocyte Polarization (A–F) Tg(flk1:EGFP)s843 wild-type (A and D), valentines259 (vtn) mutant (B and E), and heart of glassm552 (heg) mutant (C and F) larvae, visualized for GFP (green), Prox1 (blue), and Alcam (red) expression. Z-plane (A–C) and projected (D–F) confocal images of the liver at 80 hpf. (A and D) In wild-type larvae, the vascular network marked by Tg(flk1:EGFP)s843 expression and the biliary network marked by Alcam expression maintain a certain distance from each other and usually do not intersect. (B and E) In vtn s259 mutants, the intrahepatic vascular and biliary networks frequently intersect (as indicated by arrowheads). (C) In heg m552 mutants, the phenotype is similar to that of vtns259 mutants, but milder; the intrahepatic vascular and biliary networks occasionally intersect (as indicated by arrowheads). (G) Number of intersections between the intrahepatic vascular and biliary networks in wild-type, Vegf-receptor-inhibitor-treated, vegf121 mRNA-overexpressing cell hosts, vtn s259 mutants, and heg m552 mutants at 80 hpf. The error bars represent standard deviations. (H and I) vtn (H) and heg (I) expression in 80 hpf wild-type larvae. The images show lateral views, anterior to the left. Both genes appear to be expressed in endothelial cells. Asterisks indicate the common cardinal vein. Black arrowheads point to the intrahepatic vascular network. (J) Projected confocal image of the liver at 80 hpf. Larva transplanted with heg mRNA-overexpressing cells in the endoderm visualized for Alcam (pseudocolored red) and rhodamine dextran (donor cell marker; pseudocolored green). The arrowhead points to the transplanted heg mRNA-overexpressing cells inside the liver. Alcam appears to accumulate away from the heg mRNA-overexpressing cells. Alcam-expression pattern is schematically presented in (J′). |
| Genes: | |
|---|---|
| Antibodies: | |
| Fish: | |
| Anatomical Terms: | |
| Stage: | Protruding-mouth |
| Fish: | |
|---|---|
| Observed In: | |
| Stage: | Protruding-mouth |