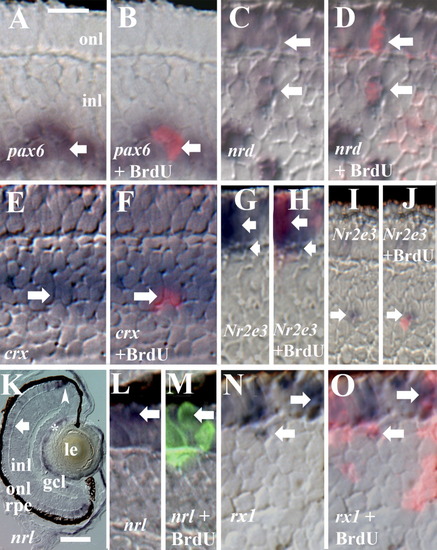
Gene expression in cells of the BrdU+ rod lineage. All embryos were injected with BrdU at 60 hpf and fixed at 75 or 80 hpf. A,B: BrdU and pax6; Nomarski optics (A) merged with epifluorescence image (B); arrow indicates colabeled cell. C,D: BrdU and NeuroD; Nomarski optics (C), merged with epifluorescence image (D); two colabeled cells are indicated by arrows. E,F: BrdU and crx; Nomarski optics (E), merged with epifluorescence image (F); arrow indicates colabeled cell. G-J: BrdU and Nr2e3; Nomarski optics (G,I), merged with epifluorescence images (H,J); colabeled cells are indicated by arrows. K: Retinal expression pattern of nrl; both rod (arrow) and cone progenitors (arrowhead) are labeled, as well as cells of the lens (*). L,M: BrdU and nrl; Nomarski optics (L), merged with epifluorescence image (M); arrow indicates colabeled cell. N,O: BrdU and rx1; Nomarski optics (N), merged with epifluorescence image (O); colabeled cells are indicated by arrows. rpe, retinal pigmented epithelium; onl, outer nuclear layer; inl, inner nuclear layer; gcl, ganglion cell layer; le, lens. Scale bar in A (applies to all except K) = 10 μm, in K = 40 μm.
|
