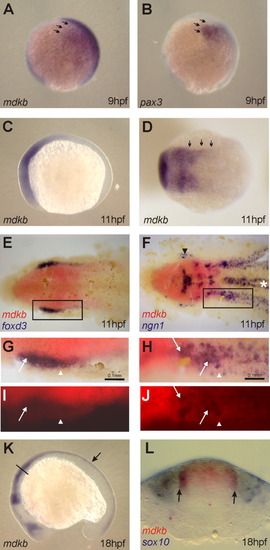
Expression of mdkb during early zebrafish development. A: Lateral view of an embryo at 90% epiboly showing mdkb expression in blue as analyzed by whole-mount in situ hybridization. B: Expression of pax3 in the lateral neural plate containing neural crest cells (ncc) precursors at the same embryonic stage. Arrows indicate overlapping expression of mdkb and pax3 in the presumptive ncc domain. C,D: Expression of mdkb at the three-somite stage (11 hours postfertilization [hpf]) in a lateral (C) and dorsal (D) view; arrows indicate expression at the edge of the neural plate at hindbrain level. E,G,I: Expression of mdkb (in red) and foxd3 (in blue) in the head/trunk region of the converging neural plate at the three-somite stage (dorsal view with anterior to the left). Note coexpression of foxd3 and mdkb in premigratory ncc precursors at the lateral neural plate border (G, higher magnification view of area boxed in E, brightfield; I, darkfield; arrows in G and I indicate foxd3 positive cells in the mdkb domain, arrowheads mark the lateral edge of the mdkb domain). F,H,J: Colocalization of mdkb and ngn1 expression in an area of forming Rohon-Beard sensory precursors (H, higher magnification brightfield view of boxed area; J, darkfield; white asterisk in F marks motor neuron precursors, black arrowhead labels trigeminal ganglia; arrows in H and J indicate ngn1-positive cells in the mdkb domain, arrowheads mark lateral edge of the mdkb domain). K: Expression of mdkb in a 18-somite stage embryo (18 hpf). Arrow indicates expression in the dorsal neural tube. L: Transverse section of an embryo at the level indicated in K, showing expression of mdkb in the dorsal neural tube (in red) and sox10 in ncc (in blue). Note overlapping expression at the border of the neural tube (marked by arrows).
|
