
Fig. 2
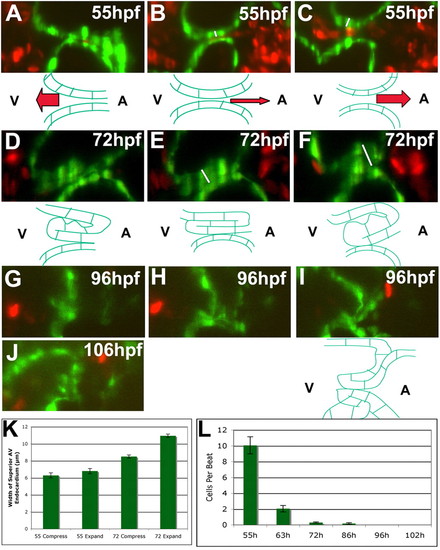
Zebrafish AVV function becomes more efficient during development. Embryos and larvae were imaged using SPIM at 55 (A-C), 72 (D-F), 96 (G-I), and 106 (J) hpf. In 55 and 72 hpf animals, the thickness of the valves at the point of highest compression (i.e. white lines in B and E) and greatest expansion (i.e. white lines in C and F) was measured and the 95% confidence interval calculated (K). The number of cells flowing retrogradely across the AVC during valve function was counted for all stages along with the 95% confidence interval (L). (A-C) At 55 hpf, the AVC closes by the action of myocardial contractions (A), rolls atrially to ventricularly (B), and finally relaxes (C). The endocardium cannot occlude the lumen in these last two phases, leading to retrograde blood flow (B,C,L). (D-F) This three-part movement of the valve is repeated at 72 hpf, but a thick invaginating valve leaflet occludes the lumen during the roll and relaxation (E,F) through its compression and expansion (K). (G,H) The same three-part movement is found at 96 hpf, but the valve leaflet hangs down to occlude the lumen during relaxation (I). (J) By 106 hpf, both a superior and inferior valve leaflet are present. Drawings underneath the frames of the 55, 72 and last frame of the 96 hpf movies illustrate the shape of the AVC endocardial tissue in these pictures. |