
Fig. 4
- ID
- ZDB-FIG-080304-4
- Publication
- Elicker et al., 2007 - Genome-wide analysis and expression profiling of the small heat shock proteins in zebrafish
- Other Figures
- All Figure Page
- Back to All Figure Page
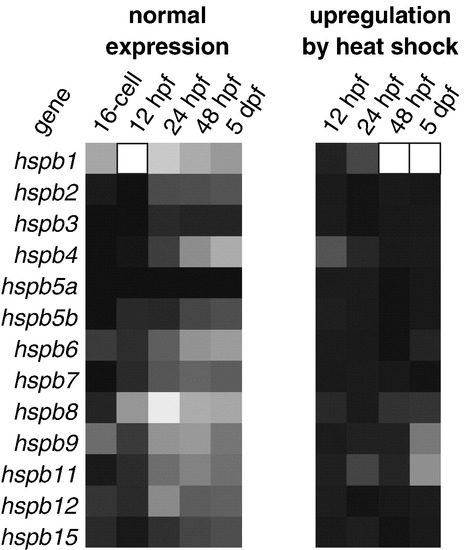
Expression of zebrafish sHSPs during development and in response to heat shock. At left is shown relative expression levels during normal development. Because of the huge range in expression levels between hspb1 and the remainder of the sHSPs, each value was multiplied by 105 and the natural log of this number was converted to greyscale intensity values, where white corresponds to the maximum observed expression level (that of hspb1 at 12 hpf). At right is heat shock-induced expression as fraction of normal. White in this case corresponds to 50-fold or greater upregulation (see Table 2 for actual values). Values are displayed on a linear scale. |
| Genes: | |
|---|---|
| Fish: | |
| Condition: | |
| Anatomical Term: | |
| Stage Range: | 16-cell to Day 5 |
Reprinted from Gene, 403(1-2), Elicker, K.S., and Hutson, L.D., Genome-wide analysis and expression profiling of the small heat shock proteins in zebrafish, 60-69, Copyright (2007) with permission from Elsevier. Full text @ Gene