
Fig. 1
- ID
- ZDB-FIG-070911-5
- Publication
- Perner et al., 2007 - The Wilms tumor genes wt1a and wt1b control different steps during formation of the zebrafish pronephros
- Other Figures
- All Figure Page
- Back to All Figure Page
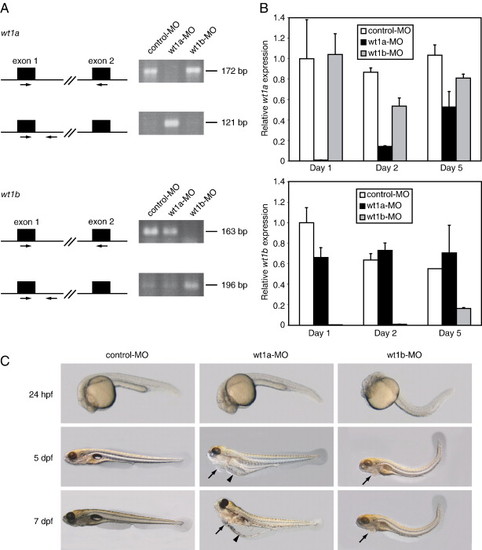
Knockdown of wt1a and wt1b induces different phenotypes. (A) After injection of control, wt1a and wt1b morpholinos, RT-PCR analysis was performed from total RNA (10 pooled embryos from each injection). Both wt1a and wt1b primer pairs (indicated by arrows) are composed of a forward primer lying in the respective exon 1 and a reverse primer lying either in exon 2 (top panels) or in intron 1 (bottom panels). (B) Quantitative real-time RT-PCR was performed from total RNA of injected and pooled embryos at the indicated stage using primer pairs as described in panel A located in exon 1 and exon 2 of wt1a (upper panel) or wt1b (lower panel), respectively. All values were normalized to beta-actin. For comparison, expression in 1-day-old control embryos was set to 1. (C) Control, wt1a and wt1b morpholino-injected embryos are shown at different stages. Pericardial edema is marked by arrows and yolk sac edema by arrowheads; wt1a-MO, wt1a exon 1–intron 1 splice morpholino; wt1b-MO, wt1b exon 1–intron 1 splice morpholino; hpf, hours post-fertilization; dpf, days post-fertilization. |
| Fish: | |
|---|---|
| Knockdown Reagents: | |
| Observed In: | |
| Stage Range: | Prim-5 to Days 7-13 |
Reprinted from Developmental Biology, 309(1), Perner, B., Englert, C., and Bollig, F., The Wilms tumor genes wt1a and wt1b control different steps during formation of the zebrafish pronephros, 87-96, Copyright (2007) with permission from Elsevier. Full text @ Dev. Biol.