
FIGURE
Fig. 3
- ID
- ZDB-FIG-070418-7
- Publication
- Chen et al., 2007 - Expression of the G protein gammaT1 subunit during zebrafish development
- Other Figures
- All Figure Page
- Back to All Figure Page
Fig. 3
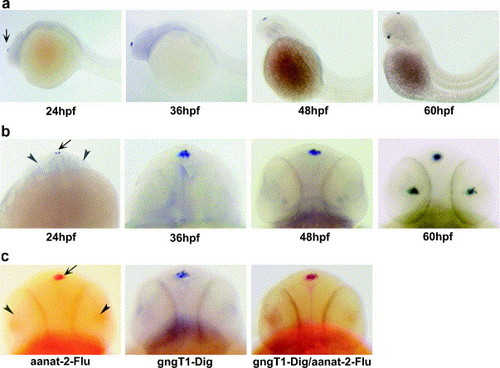
Expression pattern of gngT1 during zebrafish development. (a) Lateral view and (b) dorsal view of whole mount in situ hybridization of gngT1 in the zebrafish embryos from 24 to 60 hpf. (c) Two-color in situ hybridization using aanat-2 and gngT1 probes at night (44 hpf). Fast red staining for aanat-2 (red) and NBT/BCIP for gngT1 (blue). Flu, fluorescein in red; Dig, digoxigenin in blue. Arrow points to the pineal and arrowheads point to the eyes. |
Expression Data
| Genes: | |
|---|---|
| Fish: | |
| Anatomical Terms: | |
| Stage Range: | Prim-5 to Pec-fin |
Expression Detail
Antibody Labeling
Phenotype Data
Phenotype Detail
Acknowledgments
This image is the copyrighted work of the attributed author or publisher, and
ZFIN has permission only to display this image to its users.
Additional permissions should be obtained from the applicable author or publisher of the image.
Reprinted from Gene expression patterns : GEP, 7(5), Chen, H., Leung, T., Giger, K.E., Stauffer, A.M., Humbert, J.E., Sinha, S., Horstick, E.J., Hansen, C.A., and Robishaw, J.D., Expression of the G protein gammaT1 subunit during zebrafish development, 574-583, Copyright (2007) with permission from Elsevier. Full text @ Gene Expr. Patterns