
FIGURE
Fig. 2
- ID
- ZDB-FIG-070418-6
- Publication
- Chen et al., 2007 - Expression of the G protein gammaT1 subunit during zebrafish development
- Other Figures
- All Figure Page
- Back to All Figure Page
Fig. 2
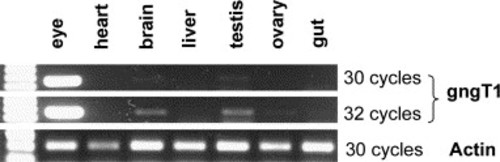
Tissue distribution of gngT1. RT-PCR analysis was performed on various tissues from 6-month old zebrafish. PCR amplification was carried out for the indicated number of cycles for gngT1 and β-actin. The latter one was used as a loading control. |
Expression Data
| Gene: | |
|---|---|
| Fish: | |
| Anatomical Terms: | |
| Stage: | Adult |
Expression Detail
Antibody Labeling
Phenotype Data
Phenotype Detail
Acknowledgments
This image is the copyrighted work of the attributed author or publisher, and
ZFIN has permission only to display this image to its users.
Additional permissions should be obtained from the applicable author or publisher of the image.
Reprinted from Gene expression patterns : GEP, 7(5), Chen, H., Leung, T., Giger, K.E., Stauffer, A.M., Humbert, J.E., Sinha, S., Horstick, E.J., Hansen, C.A., and Robishaw, J.D., Expression of the G protein gammaT1 subunit during zebrafish development, 574-583, Copyright (2007) with permission from Elsevier. Full text @ Gene Expr. Patterns