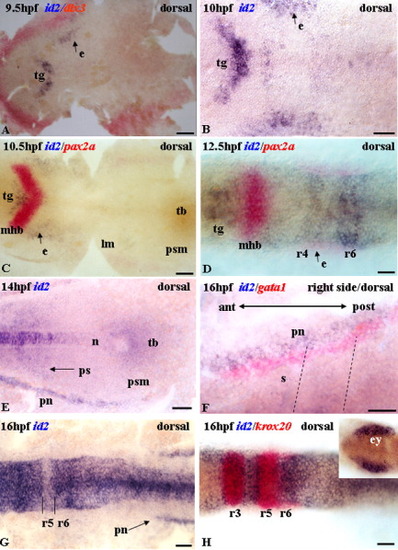
Expression of id2 during early developmental stages. All images are of flat-mounted embryos in dorsal view. A: id2 expression in the tegmentum and ear primordium. Double staining with dlx3(red), which demarcates the periphery of the embryo. B: Transcripts in the tegmentum, ear primordium, and hindbrain. C: Double staining with pax2a(red), which stains the midbrain-hindbrain boundary and confirms location of tegmentum. D: Two distinct cell clusters in the midbrain and rhombomere 6 express id2. Locality of these two clusters is confirm by double staining of id2(blue) and pax2a(red). E: Expression in the notochord, stripes of mesodermal cells at the lateral edge, presomites, and tail bud. F: Magnified right side view. Double staining with gata1(red), which stains the hematopoietic cells. Somites express id2 weakly. Black dashed lines demarcate somite boundaries. G: Expression in the hindbrain except rhombomere 5. Stripes of lateral mesoderm express id2. H: The gap in rhombomere 5 is confirmed by double staining of id2(blue) and krox-20(red). Inset, low magnification of this embryo. Expression in the eye primordium. ant, anterior; e, ear; ey, eye primordium; lm, lateral mesoderm; mhb, midbrain-hindbrain boundary; n, notochord; pn, pronephros; post, posterior; ps, presomites; psm, presomitic mesoderm; r, rhombomere; s, somite; tb, tail bud; tg, tegmentum. Scale bars = 50 μm.
|
