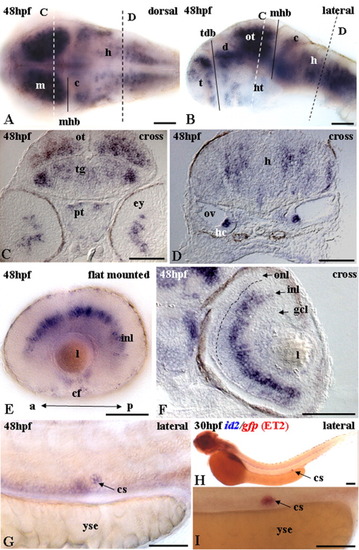
Expression of id2 at the end of the second day of development. A,B,E,G: Whole-mount; A: dorsal view; B,E,G: lateral views; C,D,F: cross-sections. A: Expression in the midbrain, cerebellum, and hindbrain. B: Lateral view of A gives a different perspective. Expression in dorsal and ventral telencephalon, hypothalamus, midbrain, cerebellum and other cells within the hindbrain. Eyes dissected out to enhance clarity of the brain region. C: Optic tectum, tegmentum, and posterior tuberculum express id2. D: Transcripts in the precursors associated with glia and hair cells. E: Flat-mounted dissected left eye shows transcripts in the inner nuclear layer. Expression is confirmed by transverse section in F. F: Expression in the inner nuclear layer. Broken line indicates the outer plexiform layer. G: Transcripts detected in the corpuscles of Stannius (cs), a single small cluster of cells on each side of the ventral trunk, just above the pronephros duct and near the end of the yolk sac extension. H: ET2 transposon line (tagging the acetyl coenzyme A gene) expresses green fluorescent protein (GFP) in the cs (Parinov et al. [2004]). Double staining with id2(blue) and gfp(red) on ET2 line. Expression of id2 colocalized with that of gfp in the cs of ET2 line. I: High magnification showing colocalization of id2 with gfp in cs of embryo in H. a, anterior; c, cerebellum; cf, choroid fissure; d, diencephalon; ey, eye; h, hindbrain; hc, hair cells; ht, hypothalamus; gcl, ganglial cell layer; inl, inner nuclear layer; l, lens; m, midbrain; mhb, midbrain-hindbrain boundary; onl, outer nuclear layer; ot, optic tectum; ov, otic vesicle; p, posterior; pt, posterior tuberculum; t, telencephalon; tdb, telen-diencephalic boundary; tg, tegmentum; yse, yolk cell extension. Dashed lines on A and B indicates position of cross-sections shown on C and D. Scale bars = 50 μ m.
|
