
- Title
-
BF170 hydrochloride enhances the emergence of hematopoietic stem and progenitor cells
- Authors
- Liu, W., Ding, Y., Shen, Z., Xu, C., Yi, W., Wang, D., Zhou, Y., Zon, L.I., Liu, J.X.
- Source
- Full text @ Development
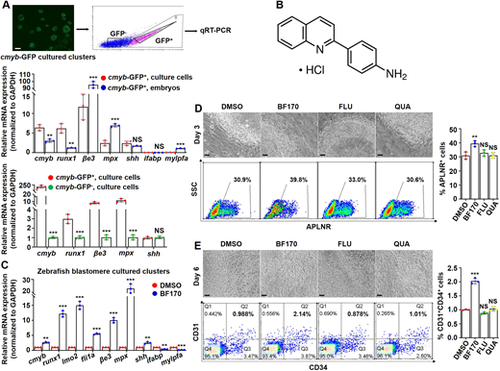
A zebrafish blastomere culture system identifies the role of the chemical drug BF170 in hematopoietic cell induction. (A) (Top) Schematic of gene expression detection in cmyb-EGFP labeled cells in zebrafish primary blastomere cultured clusters from Tg (cmyb: EGFP) embryos. (Middle) Gene expression in disassociated GFP-positive cells from cultured blastomere embryonic cells or from the whole embryos by qRT-PCR. (Bottom) The expression of marker genes in GFP-positive cells and in GFP-negative cells from the cultured cmyb-EGFP clusters; the gene expression level in GFP-negative cells was normalized to 1. (B) Chemical structure of BF170. (C) BF170 increased expression of all the tested blood-related genes in zebrafish blastomere cultured clusters. (D) The cell morphology (top) and flow cytometry analysis (bottom) of apelin receptor-positive (APLNR+) cells in human ES (H1) cells treated with DMSO (as a control), BF170, flupirtine maleate (FLU) or quazinone (QUA) at day 3. Graph shows the percentage of APLNR+ cells in different groups. (E) The cell morphology (top) and flow cytometry analysis (bottom) of H1 cells at day 6 of hematopoietic differentiation. Graph shows the percentage of CD31+CD34+ cells. Each experiment was repeated three times. Data are mean±s.d. **P<0.01, ***P<0.001. Scale bars: 20 μm in D,E; 10 μm in A. |
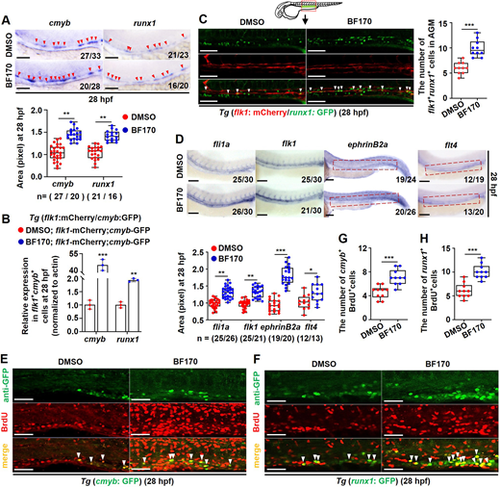
BF170 induces the emergence of hematopoietic stem and progenitor cells. (A) BF170 increased expression of both cmyb and runx1 in the whole zebrafish embryos (red arrowheads indicate positive signals). Box and whisker plot shows the quantification of runx1 and cmyb expression in the control and in the BF170-treated embryos, respectively. (B) BF170 increased expression of both cmyb and runx1 in flk1+cmyb+ double-positive cells. (C) BF170 expanded flk1+runx1+ double-positive cells in Tg (flk1: mCherry/runx1: GFP) embryos (white arrowheads indicate double-positive cells). Box and whisker plot shows the quantification of flk1+cmyb+ cells in the control and in the BF170-treated embryos. (D) BF170 increased expression of fli1a, flk1 and efnb2a (ephrin B2a), rather than flt4, in the whole embryos. Box and whisker plot shows the quantification of vessel marker gene expression in the control and in the BF170-treated embryos. (E,F) BF170 increased proliferation of runx1+ (F) and cmyb+ (E) cells in the whole embryos (white arrowheads indicate double-positive cells). (G,H) Quantification of cmyb+BrdU+ (G) and runx1+BrdU+ (H) double-positive cells in control and in BF170-treated embryos. Nchanged/Ntotal in the bottom right corner of each image in A and D indicates embryos with changed expression/total tested embryos; n values in A and D indicate the number of embryos with changed expression in each group. Images are lateral views, anterior to the left and dorsal upwards. Each experiment was repeated three times. Data are mean±s.d. In the box and whisker plots, the boxes indicate mean and the error bars indicate s.d. Whiskers indicate min to max values and all data points are shown. *P<0.05, **P<0.01, ***P<0.001. Scale bars: 100 μm. |
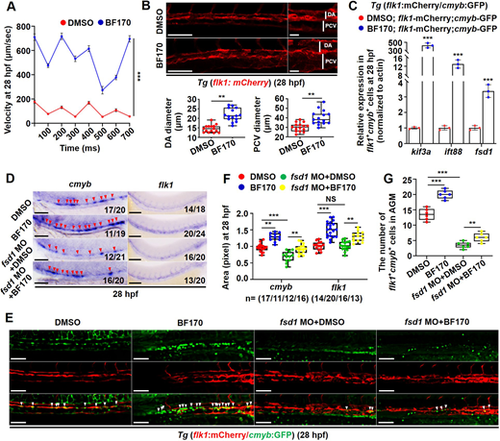
A ciliary sensor mediates the BF170-induced increase in hematopoietic stem and progenitor cells in zebrafish embryos. (A) Increased blood circulation occurred in BF170-treated embryos. (B) BF170 increased dorsal aorta (DA) and posterior cardinal vein (PCV) diameters in the aorta-gonad-mesonephros in Tg (flk1: mCherry) embryos at 28 hpf. Images on the right are magnified views of the images on the left with white vertical lines indicating DA and PCV. Box and whisker plots show quantitative analysis of vascular diameters. (C) Increased expressions of ciliary genes in flk1+cmyb+ double-positive cells in BF170-treated embryos. (D) Knockdown of the ciliary assembly gene fsd1 blocked the BF170-induced increase in expression of cmyb and flk1 in zebrafish embryos at 28 hpf. (E) Knockdown of the ciliary gene fsd1 blocked the BF170-induced increase in flk1+cmyb+ double-positive cells in zebrafish embryos at 28 hpf. (F,G) Quantification of flk1+cmyb+ double-positive cells (G) and of cmyb or flk1 expression in embryos from different groups (F). Images are lateral views, with anterior to the left and dorsal upwards. In D, Nchanged/Ntotal in the bottom right corner of each image indicates embryos with changed expression/total tested embryos. n values indicate the number of embryos with changed expression in each group. Each experiment was repeated three times. Data are mean±s.d. In the box and whisker plots, the boxes indicate mean and the error bars indicate s.d. Whiskers indicate min to max values and all data points are shown. **P<0.01, ***P<0.001. Scale bar: 100 μm in B (20 μm in higher magnifications); 100 μm in D,E. |
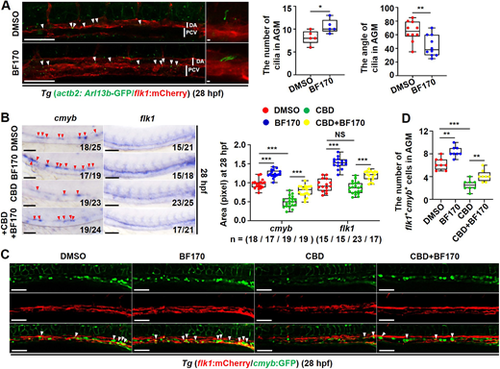
Blocking cilia function impairs BF170-induced hematopoietic stem and progenitor cell emergence. (A) Confocal images of cilia on endothelial cells (ECs) of blood vessels in the aorta-gonad-mesonephros (AGM) region in Tg (actb2: Arl13b-GFP/flk1: mCherry) embryos with BF170 treatment at 28 hpf (white arrowheads indicate the cilia on ECs of blood vessels). Images on the right are magnified views of the images on the left with white vertical lines indicating the dorsal aorta (DA) and posterior cardinal vein (PCV). Box and whisker plots show the quantification of primary cilia number and the angle of cilia in AGM. (B) Whole-mount in situ hybridization analysis of cmyb and flk1 expression in the AGM region of embryos at 28 hpf after treatment with DMSO (control), with BF170 alone, with the AAA+ATPase motor cytoplasmic dynein inhibitor ciliobrevin D (CBD, blocking cilia function) or co-treated with CBD and BF170 (red arrowheads indicate positive signals). Box and whisker plot shows quantification of the whole-mount in situ hybridization data. (C) Confocal images of the AGM in flk1: mCherry/cmyb: GFP double-transgenic line with BF170, CBD or BF170 and CBD co-treatment at 28 hpf (flk1+cmyb+ cells are indicated by white arrowheads). (D) Quantification of flk1+cmyb+ cells in C. Each experiment was repeated three times and a representative result is shown. All embryos are shown in lateral view, anterior to the left and dorsal upwards. In B, Nchanged/Ntotal in the bottom right corner of each image indicates embryos with changed expression/total tested embryos. n values indicate the number of embryos with changed expression in each group. Scale bars: 100 μm in A (2 μm in higher magnifications); 100 μm in B,C. Data are mean±s.d. (n≥3). In the box and whisker plots, the boxes indicate mean and the error bars indicate s.d. Whiskers indicate min to max values and all data points are shown. *P<0.05, **P<0.01, ***P<0.001. |
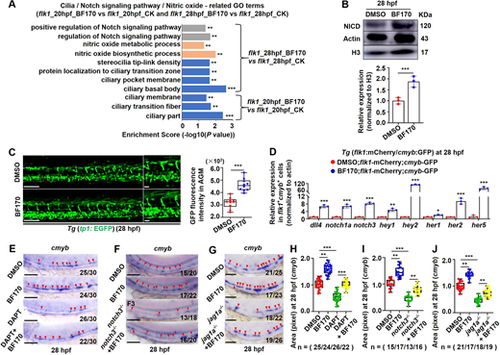
Notch signaling mediates the effects of BF170 on hematopoietic stem and progenitor cell induction. (A) Notch signaling, nitric oxide (NO) signaling and ciliary parts were enriched for differentially expressed genes (DEGs) in flk1+ cells from BF170-treated zebrafish embryo. (B,C) BF170 induced increased NICD protein levels (B) and increased Notch reporter GFP signaling (C) in the whole embryos. Images on the right in C are magnified views of the images on the left. Graphs in B and C quantify levels of NICD protein (B) and GFP-positive signals (C) in control and BF170-treated embryos. (D) BF170-induced increased expression of dll4, notch1a and notch3, and of Notch targets hey1, hey2, her1, her2 and her5 in flk1+cmyb+ double-positive cells. (E) The Notch inhibitor DAPT blocked BF170-induced increases in cmyb expression in zebrafish embryos. (F) Loss of notch3 blocked the increased cmyb expression induced by BF170. (G) Loss of jag1a suppressed the increased cmyb expression induced by BF170. Red arrowheads indicate positive signals. (H-J) Quantification of cmyb expression in embryos from different groups in E-G, respectively. Images are lateral views with anterior to the left and dorsal upwards. In E-G, Nchanged/Ntotal in the bottom right corner of each image indicates embryos with changed expression/total tested embryos. n values indicate the number of embryos with changed expression in each group. Each experiment was repeated three times. Data are mean±s.d. In the box and whisker plots, the boxes indicate mean and the error bars indicate s.d. Whiskers indicate min to max values and all data points are shown. *P<0.05, **P<0.01, ***P<0.001. Scale bars: 100 μm in C (20 μm in higher magnifications); 100 μm in E-G. |
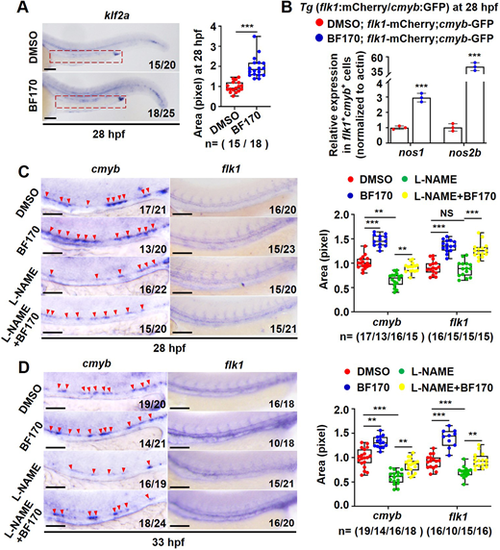
NO signaling mediates the effects of BF170 on hematopoietic stem and progenitor cell induction. (A) Increased expression of the NO sensor klf2a in BF170-treated embryos. Outlined area indicates aorta-gonad-mesonephros. Box and whisker plots show the quantification of positive signals in outlined area. (B) BF170-induced increased expression of the NO signaling genes nos1 and nos2b in flk1+cmyb+ double-positive cells. (C,D) The NO inhibitor L-NAME blocked BF170-induced hematopoietic stem and progenitor cell (HSPC) emergence in the embryos. Red arrowheads indicate positive signals. Box and whisker plots in C and D show quantification of cmyb and flk1 expression in embryos from different groups. Images are lateral views with anterior to the left and dorsal upwards. In A,C,D, Nchanged/Ntotal in the bottom right corner of each image indicates embryos with changed expression/total tested embryos. n values indicate the number of embryos with changed expression in each group. Each experiment was repeated three times. Data are mean±s.d. In the box and whisker plots, the boxes indicate mean and the error bars indicate s.d. Whiskers indicate min to max values and all data points are shown. **P<0.01, ***P<0.001. Scale bars: 100 μm. |
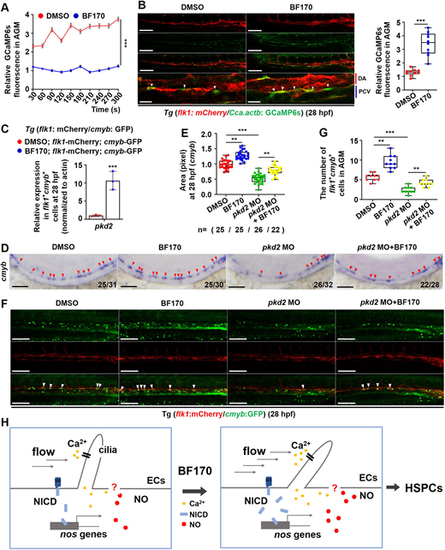
Ca2+ signaling mediates the effects of BF170 on hematopoietic stem and progenitor cell induction. (A) Calculation of GCaMP6s fluorescence signaling in the aorta-gonad-mesonephros (AGM) region in Tg (flk1: mCherry/Cca.actb: GCaMP6s) zebrafish embryos at 28 hpf. (B) Increased GCaMP6s fluorescence in the AGM region in Tg (flk1: mCherry/Cca.actb: GCaMP6s) embryos treated with BF170 [white arrowheads indicate the Ca2+ signaling in endothelial cells of the dorsal aorta (DA)]. The images on the bottom row are higher magnifications of the panels above. Box and whisker plot shows quantification of Ca2+ signaling in endothelial cells of the DA in the AGM region. (C) Increased pkd2 expression in flk1+cmyb+ double-positive cells in BF170-treated embryos. (D) Knockdown of pkd2 blocked the BF170-induced increased expression of cmyb in the zebrafish embryos at 28 hpf (red arrowheads indicate positive signals). (E) Quantification of the whole-mount in situ hybridization data. (F) Knockdown of pkd2 blocked the increased number of flk1+cmyb+ cells induced by BF170 (white arrowheads indicate double-positive cells). (G) Quantification of flk1+cmyb+ cells in F. (H) Working model for how BF170 induces hematopoietic stem and progenitor cell (HSPC) emergence. In BF170-treated embryos, endothelial cilia first sense the change of fluid shear stress generated by increased blood flow induced by BF170, then induce downstream Ca2+, followed by Notch signaling and NO production. This facilitates HSPC emergence. Images are lateral views with anterior to the left and dorsal upwards. In D, Nchanged/Ntotal in the bottom right corner of each image indicates embryos with changed expression/total tested embryos. n values indicate the number of embryos with changed expression in each group. Each experiment was repeated three times. Data are mean±s.d. In the box and whisker plots, the boxes indicate the mean and min to max values, and the whiskers indicate s.d.**P<0.01, ***P<0.001. Scale bars: 100 μm in B (20 μm in higher magnifications); 100 μm in D,E. |