
Fig. 4
- ID
- ZDB-FIG-240701-21
- Publication
- Liu et al., 2024 - BF170 hydrochloride enhances the emergence of hematopoietic stem and progenitor cells
- Other Figures
- All Figure Page
- Back to All Figure Page
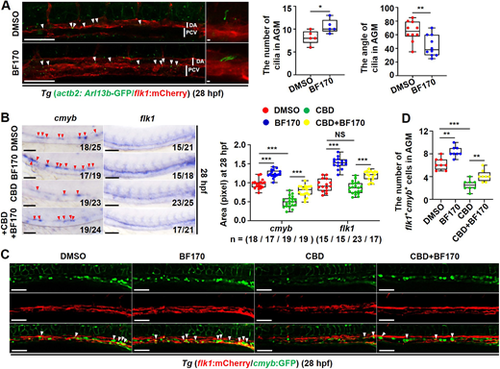
Blocking cilia function impairs BF170-induced hematopoietic stem and progenitor cell emergence. (A) Confocal images of cilia on endothelial cells (ECs) of blood vessels in the aorta-gonad-mesonephros (AGM) region in Tg (actb2: Arl13b-GFP/flk1: mCherry) embryos with BF170 treatment at 28 hpf (white arrowheads indicate the cilia on ECs of blood vessels). Images on the right are magnified views of the images on the left with white vertical lines indicating the dorsal aorta (DA) and posterior cardinal vein (PCV). Box and whisker plots show the quantification of primary cilia number and the angle of cilia in AGM. (B) Whole-mount in situ hybridization analysis of cmyb and flk1 expression in the AGM region of embryos at 28 hpf after treatment with DMSO (control), with BF170 alone, with the AAA+ATPase motor cytoplasmic dynein inhibitor ciliobrevin D (CBD, blocking cilia function) or co-treated with CBD and BF170 (red arrowheads indicate positive signals). Box and whisker plot shows quantification of the whole-mount in situ hybridization data. (C) Confocal images of the AGM in flk1: mCherry/cmyb: GFP double-transgenic line with BF170, CBD or BF170 and CBD co-treatment at 28 hpf (flk1+cmyb+ cells are indicated by white arrowheads). (D) Quantification of flk1+cmyb+ cells in C. Each experiment was repeated three times and a representative result is shown. All embryos are shown in lateral view, anterior to the left and dorsal upwards. In B, Nchanged/Ntotal in the bottom right corner of each image indicates embryos with changed expression/total tested embryos. n values indicate the number of embryos with changed expression in each group. Scale bars: 100 μm in A (2 μm in higher magnifications); 100 μm in B,C. Data are mean±s.d. (n≥3). In the box and whisker plots, the boxes indicate mean and the error bars indicate s.d. Whiskers indicate min to max values and all data points are shown. *P<0.05, **P<0.01, ***P<0.001. |