
|
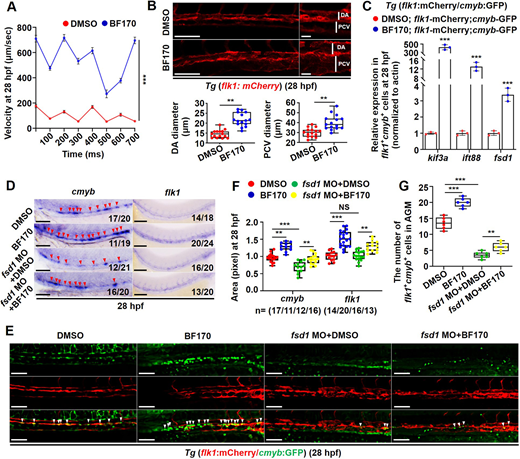
Fig. 3 A ciliary sensor mediates the BF170-induced increase in hematopoietic stem and progenitor cells in zebrafish embryos. (A) Increased blood circulation occurred in BF170-treated embryos. (B) BF170 increased dorsal aorta (DA) and posterior cardinal vein (PCV) diameters in the aorta-gonad-mesonephros in Tg (flk1: mCherry) embryos at 28 hpf. Images on the right are magnified views of the images on the left with white vertical lines indicating DA and PCV. Box and whisker plots show quantitative analysis of vascular diameters. (C) Increased expressions of ciliary genes in flk1+cmyb+ double-positive cells in BF170-treated embryos. (D) Knockdown of the ciliary assembly gene fsd1 blocked the BF170-induced increase in expression of cmyb and flk1 in zebrafish embryos at 28 hpf. (E) Knockdown of the ciliary gene fsd1 blocked the BF170-induced increase in flk1+cmyb+ double-positive cells in zebrafish embryos at 28 hpf. (F,G) Quantification of flk1+cmyb+ double-positive cells (G) and of cmyb or flk1 expression in embryos from different groups (F). Images are lateral views, with anterior to the left and dorsal upwards. In D, Nchanged/Ntotal in the bottom right corner of each image indicates embryos with changed expression/total tested embryos. n values indicate the number of embryos with changed expression in each group. Each experiment was repeated three times. Data are mean±s.d. In the box and whisker plots, the boxes indicate mean and the error bars indicate s.d. Whiskers indicate min to max values and all data points are shown. **P<0.01, ***P<0.001. Scale bar: 100 μm in B (20 μm in higher magnifications); 100 μm in D,E.