
- Title
-
The zebrafish gut microbiome influences benzo[a]pyrene developmental neurobehavioral toxicity
- Authors
- Stagaman, K., Alexiev, A., Sieler, M.J., Hammer, A., Kasschau, K.D., Truong, L., Tanguay, R.L., Sharpton, T.J.
- Source
- Full text @ Sci. Rep.
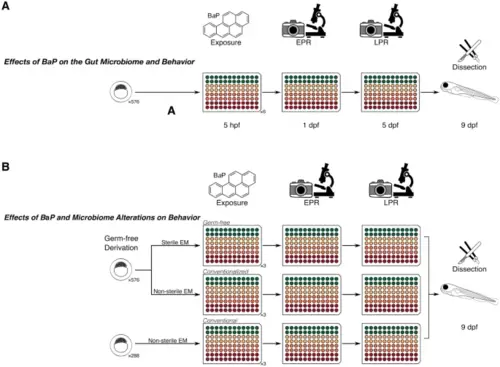
Experimental design for the study. (A) shows the design to test whether there was an effect of BaP and the gut microbiome on behavior in zebrafish. Embryos were exposed to three different concentrations (noted by the colors) in 96-well plates as shown, then measured via EPR, allowed to grow to the larval stage, and LPR behavior assays. Larvae were subsequently dissected for gut microbiome data. (B) shows the study design for the effect of gut microbiome presence on the relationship between BaP and behavior. Similarly, colors represent a gradient of BaP exposures that were applied to gnotobiotic, CV, and CVZ zebrafish embryos in 96-well plates and EPR, LPR, and microbiome data collected. This study design allows us to determine not only the associations between BaP, gut microbiome, and behavior, but also the combined effect of BaP and gut microbiome state on behavior. |
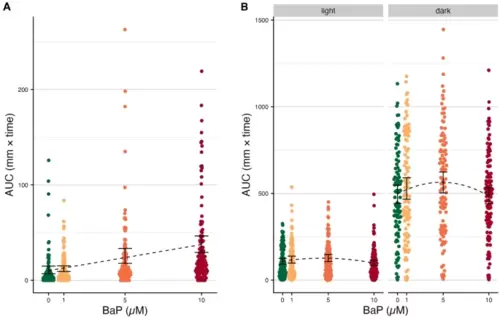
Behavior assay results (A) Embryonic photomotor response (EPR) movement data (n = 573). Areas under the curve (AUCs) for the movement curves from panel A, measured only in the window between the dotted lines. Black error bars indicate the 95% C.I.s for the mean AUC per BaP exposure level. The black dotted line indicates the estimated association from linear regression. (B) Larval photomotor response (LPR) movement data (n = 573). AUCs for the movement curves from panel A, split by cycle (light versus dark). Black error bars indicate the 95% C.I.s for the mean AUC per BaP exposure level. The black dotted line indicates the estimated association from polynomial linear regression. |
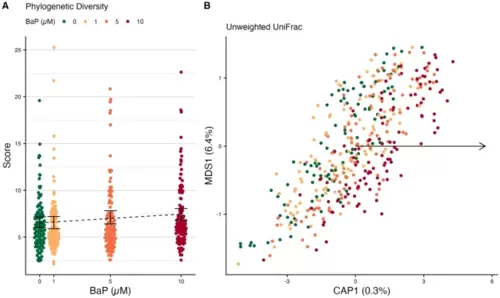
Differences in larval microbiome diversity and composition by BaP exposure. (A) Phylogenetic diversity of larval microbiomes. Black error bars represent bootstrapped 95% C.I.s around the means; the dotted black line represents the estimated trend line from regression. (B) Unweighted UniFrac beta-diversity dbRDA ordination of larval microbiomes. Points are colored by BaP exposure. The black arrow indicates the direction of the trend in BaP exposure in ordination space. Percentages in the axis labels indicate the percent variance in microbiome composition explained by each axis. |
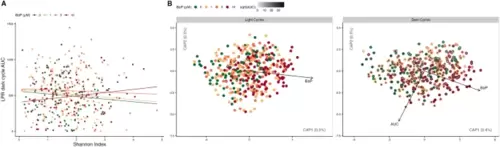
BaP effect on microbiome diversity metrics and behavior. (A) Scatter plot of alpha-diversity scores (Shannon index) on the x-axis and LPR dark cycle AUCs (larval activity) on the y-axis. Lines indicate relationships estimated from mixed-effects linear regression models, the interaction between Shannon scores and BaP exposure is significant (p = 0.038). Points and lines are colored by BaP exposure. (B) Distance-based redundancy analysis (dbRDA) ordination of unweighted UniFrac scores comparing microbiome composition between samples. Each point represents a sample, the closer the samples, the more alike their microbiome composition is according to the distance metric. Black arrows indicate the direction of greatest change in the indicated covariates. Only statistically significant relationships are shown. In the left panel, ‘light cycles’, points are colored by BaP exposure. In the right panel, ‘dark cycles’, the outer edges of the points are colored by BaP exposure while the center of the points are colored by the square-root (for visualization purposes) of the LPR AUC for each sample. |
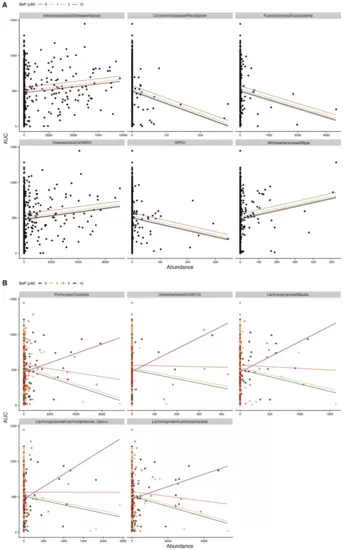
Scatter plots of taxon abundance by LPR dark cycle AUCs. (A) Examples of taxa with significant main effects, i.e., the predicted relationship is the same for all BaP exposures. (B) Examples of taxa with significant interactions, i.e., the predicted relationship is different for different levels of BaP exposure. For both panels, significance indicates p < 0.05., and lines indicate estimated regression relationships from models, colored by BaP exposure. |
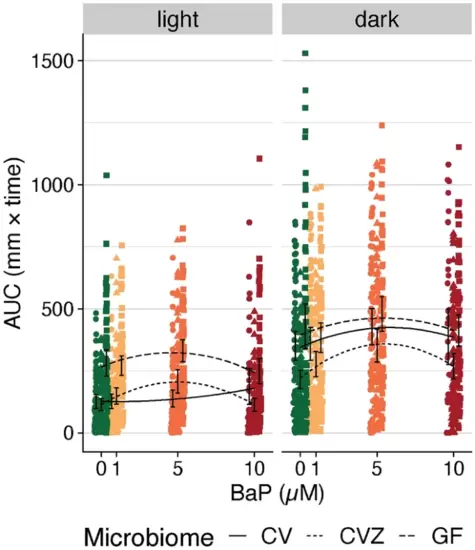
LPR movement areas under the curve (AUCs) split by light and dark. Colors represent each BaP exposure level (in µM). The black lines indicate the estimated association from polynomial linear regression, where line type corresponds to the microbiome’s state in a fish (i.e., conventional (CV), conventionalized (CVZ), or germ free (GF)). Black error bars indicate the 95% C.I.s for the mean AUC per BaP exposure level and microbiome treatment. For the light cycle, GF sample AUCs are significantly higher than CV AUCs, and there is no significant difference between CVZ AUCs and CV AUCs. There is a significant interaction between microbiome state and the second order of BaP concentration (Supp. Table 8). For the dark cycle, CVZ sample AUCs are significantly lower than CV AUCs, and there is no significant difference between GF AUCs and CV AUCs. There is no significant interaction term between microbiome state and BaP in a polynomial linear regression (Supp. Table 8). |